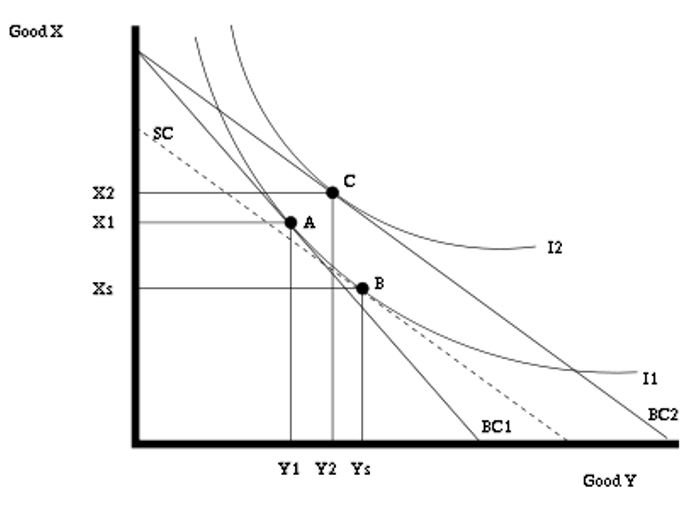
Income and substitution effects as a result of a price decrease occur because the individual’s “real” income changes (thus affecting utility) when the price of one commodity changes. The substitution effect refers to the price change that allows the consumer to enjoy the original level of satisfaction, despite having altered the gradient of the budget constraint. As a result, the change shows the consumer’s new consumption basket despite the price change, as the compensation makes the customer as better off as before the price change. As a matter of fact, the consumer has no choice but to substitute to a seemingly less expensive good, as shown by SC that is parallel to SC2.
Conversely, the income effect caused by the increase in the consumer’s purchasing power serves to underline the substitution effect. Hence the substitution effect is shown by the increase in the amount of Y demanded from Y1 to Ys; while the income effect of the price fall in good Y changes the amount of Y demanded from Ys to Y2 (partly offsetting the substitution effect).

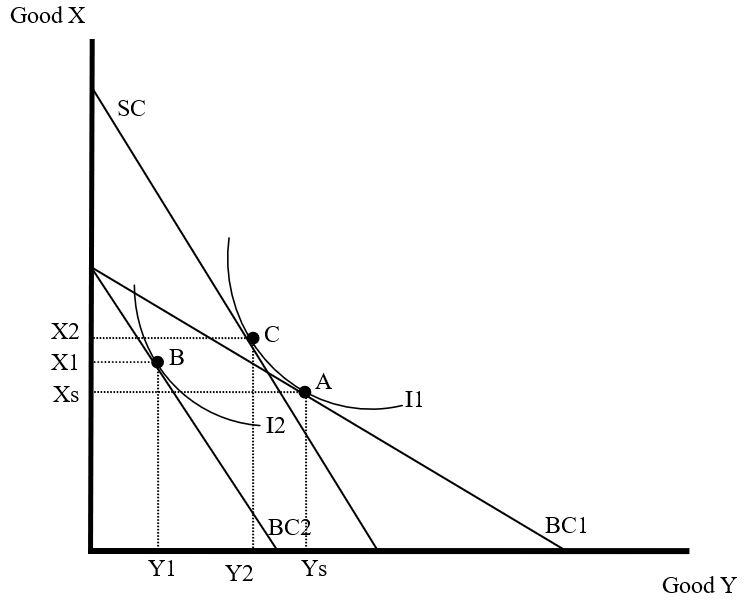
Similarly, income and substitution effects for a normal good occur when the price of good Y increases, causing the budget constraint to swivel from BC1 to BC2. The total effect is the reduction in the consumption of Y from Ys to Y1. However, if the consumer’s income would have been adjusted to compensate her for the price change, this adjustment would be enough income to cancel any impact on her welfare arising from the fall in real income. This substitution effect would be effected by increasing income at the new relative prices to allow the consumer to enjoy the original level of consumption (or remain in the original indifference curve). The compensation is shown by the rightward shift of the budget line BC2 to the hypothetical budget line SC. At the consumption basket point C, the consumer enjoys original consumption while the impact of the fall in income has been compensated.
Hence the substitution effect is shown by the reduction in quantity of Y from Ys to Y2, and the remaining reduction from Y2 to Y1 becomes the income effect.

Impact of a per unit tax on a good on its consumption using an income compensated demand curve
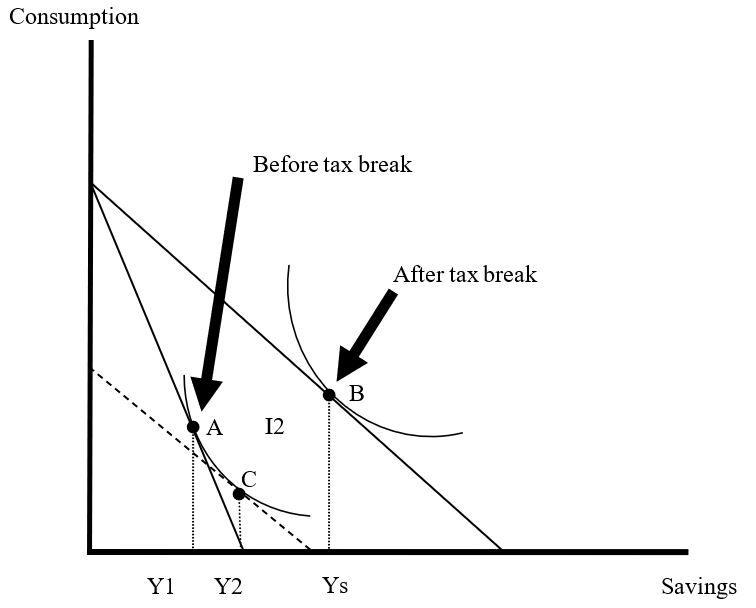
Income and substitution effects equally play a critical role in an individual’s savings decision: the tax break results in the savings becoming more rewarding in comparison with consumption. The consumer also benefits from some extra income because (s)he is able to swivel to a higher indifference curve. From the illustration below, the two effects can be separated by drawing a new budget line (dotted) whose slope is the same as the new budget line, but is tangential to the old indifference curve as the original budget line. The dotted budget line shows the consumer’s level of satisfaction if she faces the same prices as she does after the tax break, but has gotten a reduced budget that allows her to enjoy the same level of satisfaction she had been enjoying before the tax break. Hence point C, which is tangential to the original indifference curve, shows the bundle the consumer would buy if she faced the new dotted budget line. Since the price change for the consumer shifts from A to C, and her utility remains constant, there is no income effect; but an entire substitution effect. This effect causes her savings to increase from Y1 to Y2. On the contrary, the move from C to B does not have relative price changes; thus no substitution effect. Instead, the move from C to B is an indication that the price change allows her swiveling from a lower to a higher indifference curve; reflecting an income effect. The increase in her savings from Y3 to Ys means that she has more money left over once she has saved her initial amount. As such, she can choose to use the additional income for increased savings, denoted as Ys-Y2.
From the graph, it is clear that incentives offered by the government as tax breaks have two effects: first, they increase the motivation to save because they make the savings seem relatively cheaper than other investments one could do with the additional funds, depending on the individuals perspective on saving. Secondly, tax breaks leaves people with extra income to spend as they wish. However, since saving is a normal good, it is rational to assume that a majority of individuals will most likely save most of the extra income.

Consumer theory and a menu of price and service options offered to consumers
Companies (such as mobile phone companies) are likely to benefit by offering a menu of price and service options to consumers because unlike consumers in standard economic models, average consumers have to deal with the temptation and go through the costly process of self-control. While, the standard assumption implies that consumers are free from overspending, impulse buying, smoking, procrastinating, etc., the average consumer on the other hand is faced by the above temptation and can only partially control them. Although an average consumer cannot be measured as costless self-control, advances in decision making theory allow formulation of consumers’ behaviour with costly self-control.
According to the standard consumer theory, a consumer’s utility derived from a choice set greatly depends on the most preferred choice. However, adding options to the choice is likely to make the consumer better off, as more is always better. For average consumers with temptation problems, a wider choice set will discourage them in the strict sense since it may include tempting choices which would otherwise be undesirable from the ex ante perspective. For example, a dieter may avoid all-you-can-eat buffets knowing that she will be tempted to end up eating other activities.
Assuming that consumers preferring a smaller choice set subscribed to a certain class of preferences against another, i.e. a consumer preferring choice set X to set Y, certain requisite conditions should be met; i.e. iff W(X) > W(Y). Thus the consumer relies on utility functions U and V, whereby utility function U include such preferences as a customer would prefer to commit to the desire to save more, quit smoking, lose weight, work hard, etc., while utility function V represents the urge to buy, smoke, eat, be lazy, etc.
The strength of self-control is given by the “bargaining power” of each utility function, denoted by the relative scales of the functions, especially after the customer has compromised between the two conflicting motives. Thus unlike the monopolist situation where he sells a good and sets a nonlinear price schedule, which the per-unit price depends on the consumers’ chosen quantity, this case extends the pricing problem to the situation where consumers have to contend with the temptation problem. On the other hand, the seller offers more than one menu because the number of menus does not matter, and the consumer’s welfare is also affected by the tempting choices.
For cell phone carriers, offering multiple plans associated with the nonlinear price schedules means that consumers make choices in two steps. First, they choose a plan and then choose the number of minutes of talk time; thus the seller has to deal with both of the consumer’s conditions. The “direction” of temptation determines the character of profit-maximization scheme on the basis of the consumer’s U and V functions. As such, a consumer has upward temptation if his marginal value for the additional unit is higher when tempted than when he is not. On the contrary, a consumer has a downward temptation if his marginal value is lower under temptation.
Thus, if consumers have upward temptation, then the seller can extract all surpluses. This can be achieved by offering a separate menu for each individual type of consumers and add to the menu intended for the low types a choice that is irrelevant for the low types but is tempting and ex ante undesirable for the high types. Therefore, a good strategy for cell phone carriers is to design a plan for low-demand consumers so that if high-demanded consumers choose it they would be tempted to spend more than they desire ex ante. Low-demand consumer plans are typical of low monthly fees, high per-minute rate for additional minutes and few free minutes. In the prescribed strategy for cell phone companies, the rate for additional minutes should be set to meet certain constraints: i.e. it should be as low as possible so that if high-demand consumers choose the plan, they will feel the temptation to talk beyond the free minutes; and should also be equally high so that the high-demand consumers who anticipate the temptation will be discouraged from the plan that has been customized for the low-demand consumers.
Full surplus extraction results have been determined as consistent even if V is as close to U for each consumer. However, the result can only hold and the sufficient condition is that the marginal value be higher for the temptation preferences (V) than for the commitment preferences (U). The difference can either be positive or negative as long as the model is not standard. Hence, the company is in a position to extract maximum surplus even if the model is only a perturbation of the standard model. But when V is close to U, the strategic item that the seller puts in the low-type menu involves a very large quantity, which may not be feasible if there is a technological upper bound on quantity. Thus with an upper bound on quantity, the strategic item in the optimal scheme has the highest possible quantity when temptation is minimal.
Unfortunately, if the temptation of consumers is to buy a smaller quantity, i.e., the case of “downward” temptation, full surplus extraction is not possible. An optimal scheme is characterized by entry fees, fees that consumers must pay even if they end up buying nothing. Hence, entry fees can make self-control easier since they make quitting more expensive and thus less tempting, compared to the case where consumers can get refunds by quitting.