Introduction
The current research is anchored upon two main points of concern related to some exposure concerning the topic of the study. These two points will be considered majorly in relation to the issues that affect exchange rate. First of all, the focal point of this study is the effect of interest rate and inflation rates on exchange rate, as well as the time when the effect becomes adversely experienced. The question at hand is; what happens to the foreign exchange rate of NZDUSD whenever there is a change of this variables?
The second observation point to be made pertains to the differences in the exchange rate of NZDUSD among the two viable.
Methodology of the study
There is the need for coming up with a fine way of obtaining the necessary information and performing the necessary analysis in this study. The methods employed here have been considered due to their relevance and accuracy in use. The inflation and interest rates have been used as the response variables that are the dependent variables, and the New Zealand/ US dollar exchange rate has been used as the explanatory variable that is the independent variable. A basic OLS regression will then be run in order to see how these two variables are related to each other. The validity of the model will also be checked in order to discuss if there will be a violation of any assumptions. As it has been mentioned earlier, for the sake of coming up with a more conclusive deduction, there is a need to use more than one variable. The outcome for the simple regression will also be studied and some factors will be included in the model. The outcome will be checked for any form of difference with the model again.
In the data given, the formulation of numerical data is seen to have certain assumptions which are not satisfied with regard to the population samples used. The numerical hypothesis provides no basis for the choice of the confidence level of 95% in relation to the number of analysis to be performed. The basis for testing the null hypothesis is affected by the nature of sample distribution.
Data collected
The data used in this analysis is taken from the year 1989 in order to easier comparability of the results. This is because NZD was under control regime up to 1985, and the central bank introduced inflation targeting in 1989. If we use the data with different starting dates, comparability will not be consistent.
Here the interest and inflation rates can be seen as the ones that influence the increase steadily year after year. During this period, there was increase in exchange rate. As it was mentioned in Kapil (2011), “the investment and exchange rates volatility on the United States had significant impact on investment in the country, and they had a great impact in smaller and liberalized countries as well”. (p. 625). It is very important to put in mind that the figures shown in the tables involve some truncations and rounding off, and may thus not be one hundred percent accurate, but they are sufficiently close to the actual figures within the specified period. They can be relied on to give the necessary guidance on the issue at hand, and make the necessary deductions about the same.
Results
“Abnormal increase in inflation has a great impact on fixed income securities (Kapil, 2011, p, 152). Inflation creates a problem since borrowing a high –inflation currency becomes a hard to analyze statements. Such currencies normally have extreme high nominal interest rates, which usually ‘reflects compounding within a year’ (Moles, Parrino & Kidwell, 2011, p. 225), as the lender must be compensated for the loss of purchasing power. The high interest rate is acceptable because the borrower invests in comparatively inflation – proof asset exposure. The high interest expense, in reality, is mostly offset by the purchasing power gain from the diminishing real value of the debt (Shapiro, 2007,pp. 202).
This adjustment effectively replaces nominal interest expense with real interest expense, much closer to the interest measure in countries with lower inflation rates, it is also incidentally, and reduces interests’ expense increasing the interest coverage ratio.

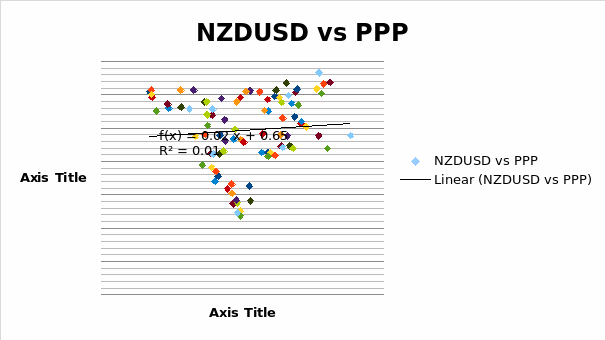
The graph plotted above indicates an increasing trend. From the regression analysis performed, the following regression equation can be derived based on stepwise method:
NZD/USD=0.352x+0.376 and R2= 0.006
The stepwise regression equation presented above indicates the coefficient of determination R-squared as.006, which suggests that the stepwise regression performed between variables, is only able to predict 0.6% of the total variations observed in the values. The total variations is.105 from which.078 are explained via regression whereas 0.099 remain unexplained. This could be due to the lagging effect in the values, which is not addressed in this analysis. In addition, it is not addressed in this analysis due to the certain values that can be considered as outliers observed within the data.
As far as statistical analysis is concerned in this paper, two “t” tailed tests have been used in order to check the statistical significance of the coefficient of the regression. The‘t’ statistic is statistically significant then, as it is 1.18 meaning this variable can influence exchange rate positively.
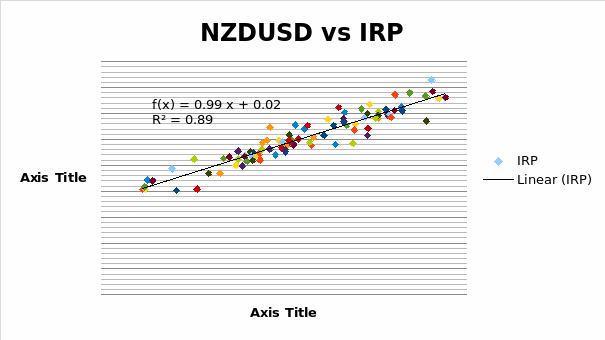
NZDUSD vs. IRP are analyzed in the graph presented below. It can be noted that there is an upward trend in the interest rate. These interest rates affect the flow of foreign currency which, in its turn, affects the economy of the country. There is a spontaneous reaction of the current and capital accounts of the economy, as the interest rates of the same country are affected as well. The supply and demand of goods and services are affected by the nominal interest rates prevailing in the economy if the interest rates goes up, it affects the inflation and this calls for the change in the way things are done in the economy of any country (Correia, Flynn and Uliana, 2007).
International flow of capital heavily depends on investors’ expectations of rates of return in one country relative to other countries. Other things being equal, if interest rates rise in one country and stay the same in other countries, then the demand for the first country’s currency will increase, as investors move capital to the country with the higher rate of return. The same argument holds, of course, for international differences in rates of return generally, and not just interest rate differentials (Shapiro, 2007,pp. 106).
An important point in analyzing international capital flow is that individuals and firms move capital based on expectations of relative rates of return, and they do not move capital to finance a current-account deficit, or to get rid of a current account surplus. Ignoring statistical problems that create the statistical discrepancy, the capital-account surplus is necessarily equal to the current account passively finances the current account. The current and capital accounts are determined simultaneously through the interaction of all supplies and demands in the foreign exchange market.

The coefficient of IRP is 0.986. The positive value of coefficient is perhaps what is expected one could have regarding the relationship between NZD/USD and IRP. It is a common understanding that interest tend to increase foreign exchange rate and the model is suggesting that there is a direct relationship between the two variable. Therefore, the regression model implemented has predicted a positive relationship. The t-statistics for IRP is 0.6939; this means that the value has greater influence on the exchange rate. The above conclusion is supported by the result of the regression analysis presented in above.
Multiple regressions
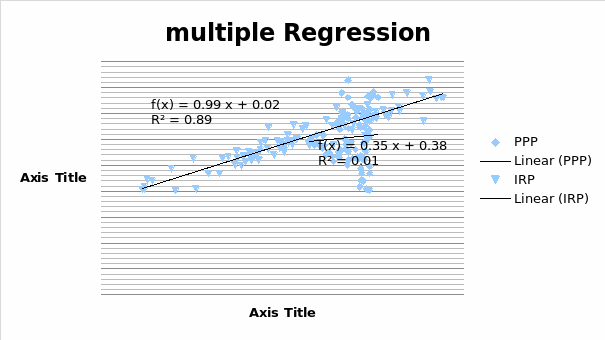
Comparing these values, it can be observed that there is a difference between both values. From the provided table, the value of coefficient of which is PPP is less than the value of IRP using the regression equation. This difference explains that IRP has the ability to influence Exchange rate more than PPP and the regression to predict the variations assessed by the value of coefficient of determination that is only able to predict 89.0% of the total variations in the values of variables as compared to 0.6% of the PPP.

Recommendation and conclusion
Analyzing the information provided earlier in this paper, we can come to certain conclusions and provide the necessary recommendations that might improve situation. There is a positive coefficient between the variables from the calculations above. This means that providing more positive changes, any variable will influence the exchange rate.
Purchasing power parity does not work reasonably well in predicting the exchange rate between two countries when one of them experiences substantial inflation. In fact, the doctrine works reasonably well if two countries experience inflation, even at substantially different rates. Thus, supposing that prices in continentals rise by four times over a three- year period, whereas prices in regal rise by two times over the same period, we can come to a conclusion that in this situation, the theory of purchasing power parity predicts that the exchange rate should change so that the number of continentals per regal should doubled (Brealey, R., Myers and Marcus, 2007).
References
Brealey, R. , Myers S. & Marcus Alan. (2007). Fundamentals Of Corporate Finance. Boston: McGraw-Hill.
Correia, C., Flynn, D., & Uliana, E. (2007). Financial Management. Cape Town: Juta and Company Ltd.
Kapil, S. (2011). Financial Management. New Delhi: Pearson Education India.
Moles, P., Parrino, R., & Kidwell, D. (2011). Fundamentals of Corporate Finance. San Francinsco: John Wiley and Sons.
Shapiro, A. (2007). Foundations of Multinational Financial Management. New York: John Wiley & sons, Inc.