Trend of exchange rate over time
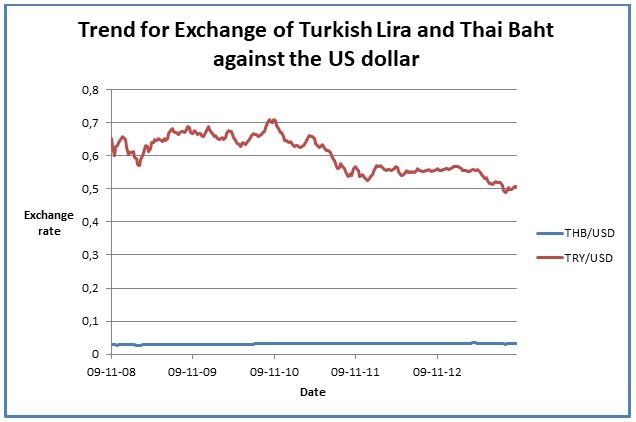
The graph presented below shows the trend of the weekly exchange rate of the Turkish Lira and Thai Baht against the US dollar for a period of five years that is, between 2008 and 2013.

Based on the graph above, it can be observed that the exchange rate of Turkish Lira was higher than the exchange rate of Thai Baht over the five-year period. The range of exchange rate for the Turkish Lira was between 0.5 and 0.8 while the exchange rate for the Thai Baht against the US dollar was below 0.1 throughout the period. Secondly, it can be observed that the exchange rate for the Turkish Lira against the US dollar fluctuated during the period. There was a slight appreciation in the exchange rate between 2008 and 2009.
This indicates that the economy of the country grew strong during the period. Thereafter, the exchange rate depreciated by a small margin between 2009 and 2011. This was caused by the global financial crisis. Between 2012 and 2013, there was an appreciation of the exchange rate. This indicates that the economy recovered from the financial crisis. The country heavily relies on international trade as a key source of income.
Therefore, fluctuations in the value of the exchange rate are as a result of market changes. It indicates that the country operates a flexible exchange rate regime. On the other hand, it can be observed the exchange rate for the Thai Baht against the US dollar was fairly constant throughout the period. The value depreciated slightly from values ranging between 0.02 and 0.03. It indicates that the country operates a managed exchange rate regime.
Bid and ask price
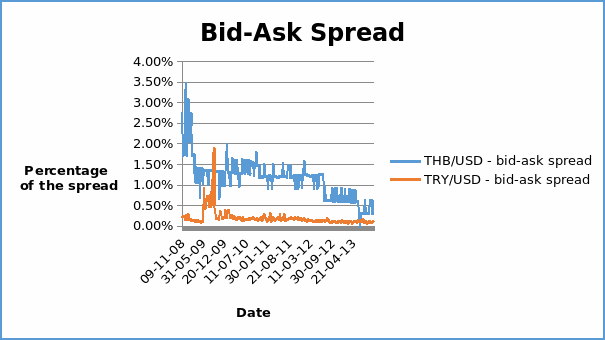
The graph presented below shows the bid-ask spread expressed as percentages for the weekly exchange rate of the Turkish Lira and Thai Baht against the US dollar for a period of five years.

The graph presented above indicates that the percentage of the bid-ask spread for the exchange rate of the Thai Baht against the US dollar was higher than the percentage spread for the Turkish Lira against the US dollar for between part of the five-year period. The bid-ask spread for the exchange rate of the Thai Baht against the US dollar was quite high in 2008.
However, by the end of the 2008, the spread declined significantly. It remained fairly stationary between 2009 and 2011. However, in 2012, the company experienced a decline in the value of percentage spread. The high percentage spread can be attributed to a number of factors.
The key factor is the perceived risk and political instability in the country. Volatility in the economic conditions in the country also explains the high value of the bid-ask spread. On the other hand, the percentage bid-ask spread for the exchange rate of the Turkish Lira against the US dollar escalated in early 2009. This can be attributed to the global crisis. Thereafter, the spread remained quite low and stable. The lower bid-ask spread is as a result of a large volume of shares traded (OANDA Corporation 1).
Cross rates
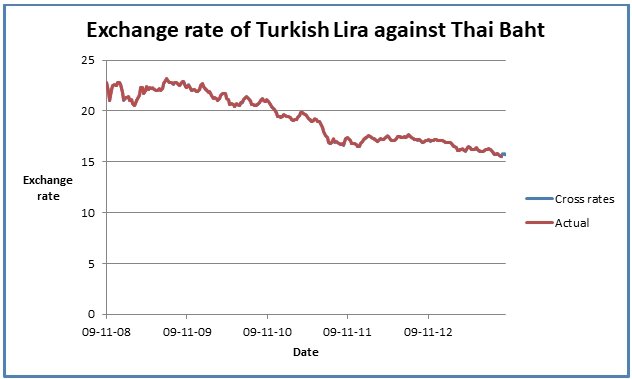
The graph presented below shows the trend of the spot exchange rate of Turkish Lira against the Thai Baht for the five-year period.

The graph above indicates that there was a gradual decline in the value of the cross exchange rate during the five-year period. Besides, it can be observed that the graph of actual exchange rate is superimposed on the graph of cross rates calculated. It implies that the calculated cross rate is similar to the actual rate extracted (OANDA Corporation 1).
Works Cited
OANDA Corporation 2013, Historical Exchange Rate. Web.