Introduction
Interpretation and extraction of information from remote sensing images are fundamental concepts that define image processing and analysis approaches. Much information is required from images for effective interpretation (Liew, 2001). Consequently, various techniques and algorithms have been developed, but their usages depend on the objective of each image. Image enhancement techniques work by enhancing the quality of image to aid interpretation while feature extraction methods are vital for extracting as much information as possible from remote sensing images. In this report, a study area of Rushworth, Victoria North of Melbourne has been selected to demonstrate some techniques applied in analysing and interpreting remote sensing images. Rushworth is located 157 km north of Melbourne via the Hume Freeway and Goulburn Valley Highway.
Objective
- To demonstrate the spatial information of various land covers within an image
- To use image enhancing techniques and derive the NDVI to be applied in interpretation of the location and areal extent of forest and crop coverage in the region and identify vegetated and non-vegetated zones
Data source
Data for the study will be obtained from the Rapideye image of Rushworth, Victoria.
Software
Erdas Imagine software will be used for image enhancement and analysis. All results will be reported using MS Word.
Method
The study methods applied in this study were obtained and followed as described in the exercise note.
- Blue – represents water
- Green – shows vegetated regions
- Red – represents non-vegetated areas or bare areas
The Results and Discussion of Imaging Tasks
Task 1: Band combinations
Rapideye bands and channels were used to determine the most reliable forms discrimination of various land cover types. Band 5 depicted red, band 4 highlighted Blue while band 3 captured Green (see figure 1). These Band selection and combination were appropriate for depicting bare areas or non-vegetated regions, vegetated regions and water.

Task 2: Image enhancement and Different Algorithms
The General Contrast technique and standard deviation were applied to enhance and enlarge the image. Consequently, both road and drainage patterns could be easily identified from the image. All bands were readily visible because of these techniques. A linear transformation was used to enhance slightly dark parts of the image. This adjustment was also possible with the Breakpoint Editor, which was applied to identify image changes (see figure 2).

Task 3: A spectral profile of a point (water, pasture, crop and forest land covers)
The Spectral Profile is applied when visualising reflectance spectrum of a single pixel through many bands (Xie, Sha, & Yu, 2008). This method is specifically relevant for hyperspectral data, which can contain multiple layers. Through Spectral Profile, one can assess the chemical elements of materials in the pixel. In addition, the technique can be applied to compare profiles from different sources (from the laboratory or field).
Further, it shows data value plots and other statistical information such as mean, minimum and maximum values, and standard deviation. These values are plotted in various colours while the graph may be stretched to enhance clarity (see figure 3).

Water has higher absorption and lower reflectance (<.1) and bare land has lower absorption and higher reflectance (>.2) of light. On the other hand, water and irrigated lands have reflectance of approximately in between <.1 and <.2. It means they have higher reflectance compared to water and lower reflectance compared to bare land.
Reflectance values between the band 3 and band 5 for forest slowly increases from band 3 to band 4 and then increases significantly from band 4 to band 5. Reflectance values for agriculture crop increases similar to water from band 3 to band 4, but then increases significantly and higher than water from band 4 to band 5. Reflectance values for bare soil slightly decreases from band 3 to band 4 and then slowly increases from band 4 to band 5 (reflectance approx. 3.5).
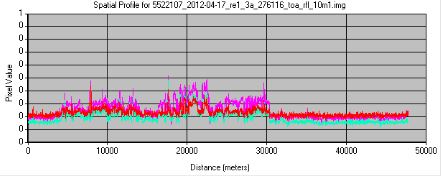
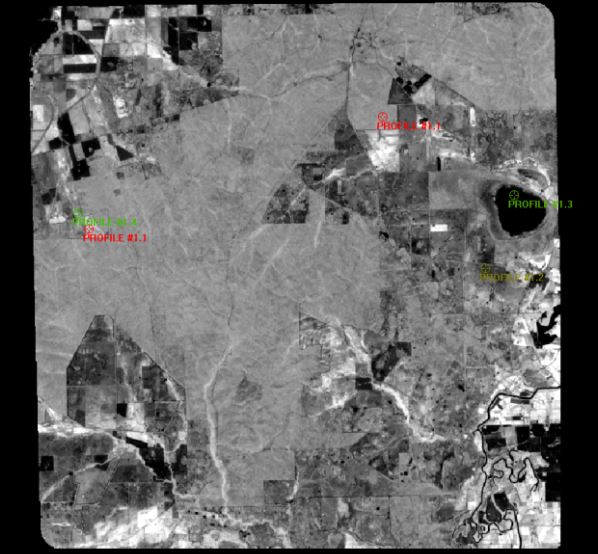
Task 4: Creating a spatial profile of an area that includes various land cover types
A spatial profile viewer was applied to visualise transformation in the elevation in various parts of the image. The selected features reflected that the land type appeared relatively flat, but with small higher points (see figure 4).
A Spatial Profile Viewer can be used to visualise the reflectance spectrum of a polyline of data file values in a single band of data (one-dimensional mode) or in many bands (perspective three-dimensional mode). The Digital Elevation Model (DEM) is the most common type of single band data profile applied when generating a height cross-section profile for a given route. It aids in interpreting transformation elevated along an identified route and in locating a given part of a route that is flat or steep.
The height profile like the observer line of site can be use to analyse data. Assigned colour coding to parts of the profile, for instance, can be used locate the end of the line. Hyperspectral data require the multiple band technique to analyse several hundreds of layers. It is possible to create grayscale raster image from the profile, overlay the image or develop a thematic image on the profile. In addition, profiles could be changed to different formats for ease of embedment into other documents like reports and maps.
Statistical data and plot of data file values are also possible to view in a table format through the map, while file directs various points along the polyline.
NDVI creation
The Normalized Difference Vegetation Index (NDVI) or the Vegetation Index is used to quantify concentrations of green leaf vegetation, greenness or photosynthetic activities (Weier & Herring, 2000). This Index is common and it helps in determining greenness. Red light is absorbed during photosynthesis while infrared light may be reflected. Dead or stressed vegetation show high percentage red light reflected. On the other hand, non-vegetated areas offer much light reflectance.
NDVI figures range from -1 to +1 that depicts both vegetated and non-vegetated locations (Weier & Herring, 2000). Any negative values show that no vegetations exist while positive values highlight the presence of vegetation.
Conclusion
The report has explored image enhancement and feature extraction in Victoria North of Melbourne. The results demonstrated image enhancement of Rapideye image by Erdas Imagine. Bands or combinations of bands are used to extract land cover features effectively. Spectral and Spatial profiles demonstrated were used to identify spectral reflectance of various land features and any transformations in land surface. Finally, NDVI demonstrated how to measure the density of green on a patch of land (Bhandari, Kumar, & Singh, 2014).
Reference List
Bhandari, A, Kumar, K & Singh, K 2014, ‘Improved feature extraction scheme for satellite images using NDVI and NDWI technique based on DWT and SVD’, Arabian Journal of Geosciences. Web.
Liew, C 2001, Image Processing and Analysis. Web.
Weier, J & Herring, D 2000, Measuring Vegetation. Web.
Xie, Y, Sha, Z & Yu, M 2008, ‘Remote sensing imagery in vegetation mapping: a review’, Journal of Plant Ecology, vol. 1, no. 1, pp. 9-23. Web.