Summary of portfolio
Table: 2 Weekly price movements of the selected portfolio including purchase and disposal prices
Energy Sector
Beach Energy Limited BPT
Beach Energy reported to share dividends to an amount of $0.1121 in 2013. It gives a dividend yield of 2.08%. The dividend yield is important for long-term investors. It reported a net profit margin of 21.94% and an operating margin of 30.55%. It shows that the firm is operating very profitably (BPT: ASX, 2013).
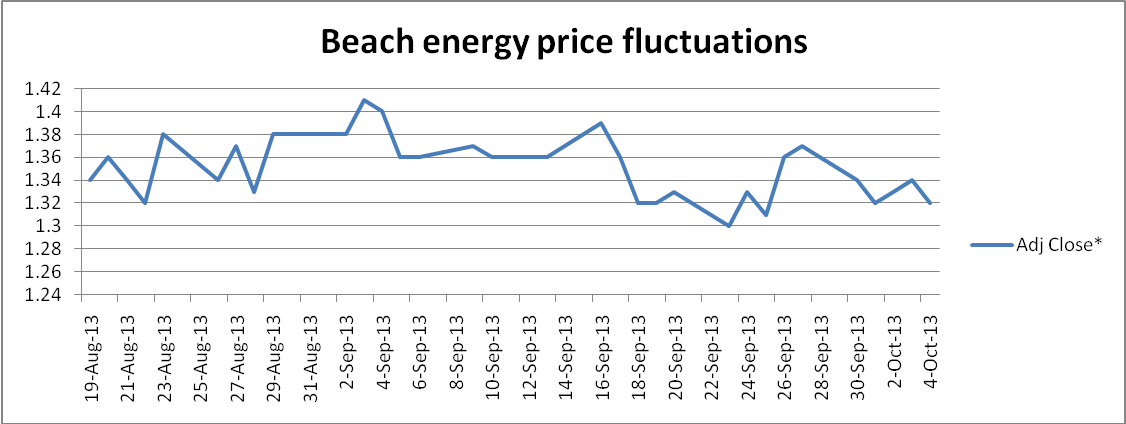
The graph shows that its stock price has been volatile throughout the investment period. Volatility could explained from high expectation from investors who look at it net returns. With a reported beta of 0.8569, it fluctuates more than by market fluctuations (BPT: ASX, 2013).
Caltex Australia CTX
Caltex Australia reported EPS of 0.3142 and annual dividend yield of 2.16%. Its net profit margin is 0.37% and return on equity of 3.71% (CTX: ASX, 2013). Beach Energy appears to have a better financial performance.
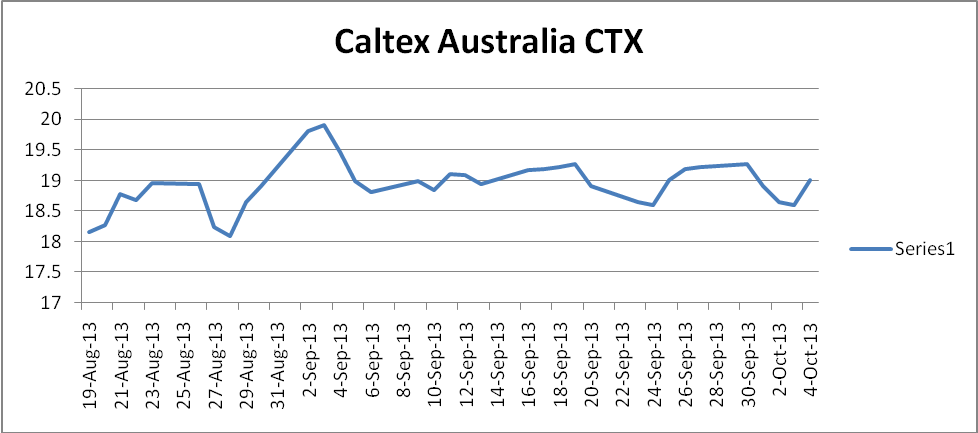
Caltex stock prices are unstable. However, it still provides opportunities for investment because upward movements are by bigger margins.
Drillsearch Energy DLS
Drillsearch Energy reported a net profit margin of 44.08% and an operating margin of 17.39%. It indicates exceptionally good financial performance. EPS were at $0.0706. It does not match the profitability meaning the firm has reinvesting. Returns on equity estimated at 21.03% and return on investment at 15.66% (DLS: ASX, 2013). It shows the firm’s investment activities have been well chosen. Most investors will be attracted by the good performance and reinvestment capabilities.
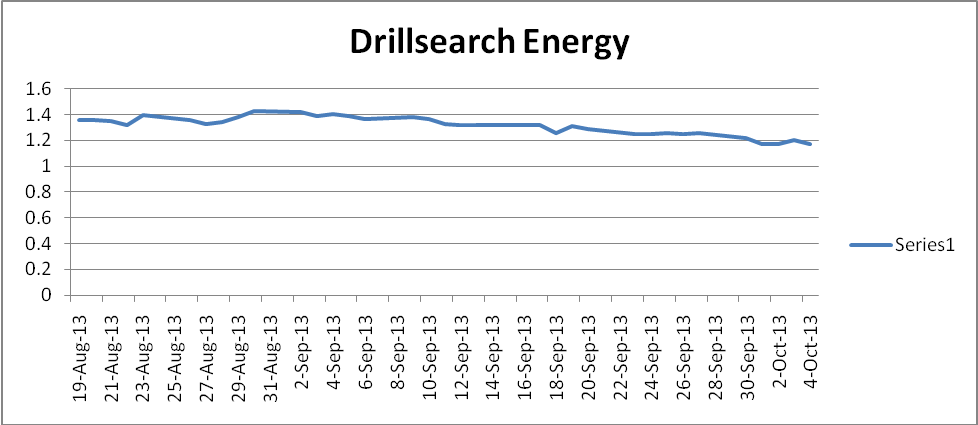
Drillsearch stock price graph does not show wide variations. However, an investor may be concerned about the continuous downward trend of the stock price.
Jupiter Energy JBR
Jupiter net margin is -84.56%. It shows the company reported large losses in the year that ended 30 June 2013. Return on equity is -10.50% and reported EPS is -0.0326 AUD (JPR: ASX, 2013). It shows the firm could either be meeting expansion costs or it has poor financial performance.
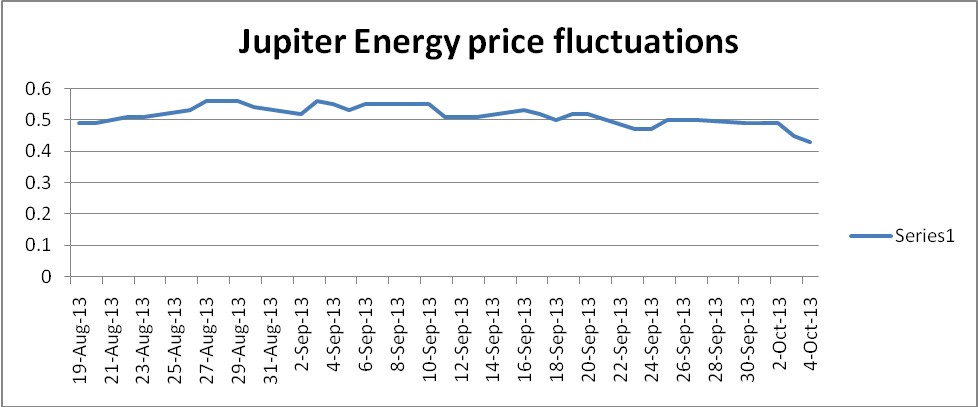
Jupiter stock price shows minor variations in prices. After the middle part, it has a downward trend that could result in capital losses. In the beginning, it appeared to be a promising investment.
Z-Energy ZNZ
The company’s revenue has been falling by about 5% for the five year period. In 2013, it reported an increase in net income 13.42%. Net income moved from $120.7 million to $136.9 million (ZNZ: ASX, 2013). Reduced revenues with increased net income could show that the firm has developed more efficient methods of production. It could be even more profitable in the future.
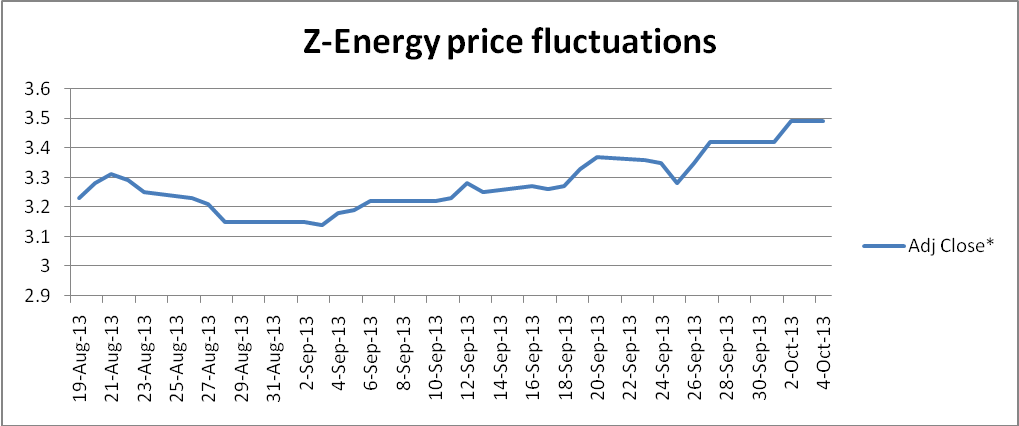
After the third day, an investor could most likely think of further loss. In the middle part, the stock regains its market value. It is on an upward trend despite the fluctuations.
Materials Sector
CuDeco Ltd CDU
The company reported a net profit margin of -111.03%, and an operating margin of -134.03%. It may indicate that company is involved expansion activities or poor financial performance. Return on equity is at -1.35% and return on investment at -1.35% (CDU: ASX, 2013). A short-term investor would not prefer to invest in a company reporting large net losses.
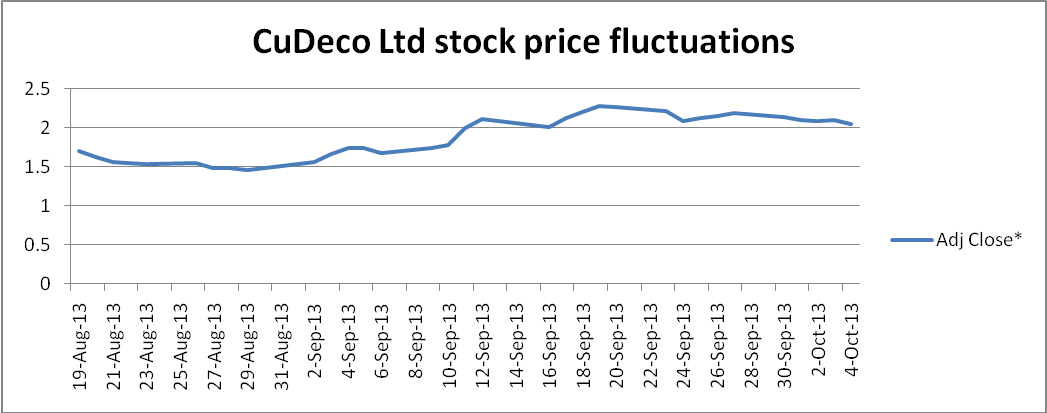
CuDeco stock price movement is impressive because it is always above the price from which they were acquired. It shows investor confidence in the stock. It starts to decline towards the end of the investment period. These are minor fluctuations. It may provide an investor with time to sell before they drop even further. High losses and increasing stock price are signs of the firm engaging in expansion opportunities.
Sims Metal SGM
The company reported an EPS of -2.280 AUD. It had a net profit margin of -6.47%. Return on equity is estimated at -22.13% (SGM: ASX, 2013). It shows poor financial performance that sometimes is caused by a firm spending more on growth.
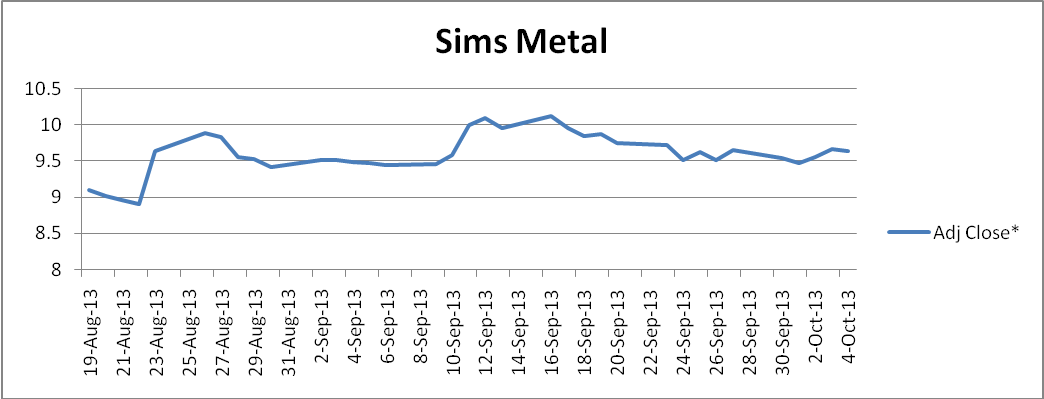
The firm shows an upward trend that now has become common to most companies reporting negative net income. These firms are engaged in expansion activities promising future higher earnings. Long-term investors seek to purchase the stock when shareholders prefer to hold them until prices rise further. It started with wide fluctuations at the beginning which could have been an effect of reporting losses for the period that ended 30 June 2013. The price may have regained after investors examined its growth opportunities.
Colorpark CKL
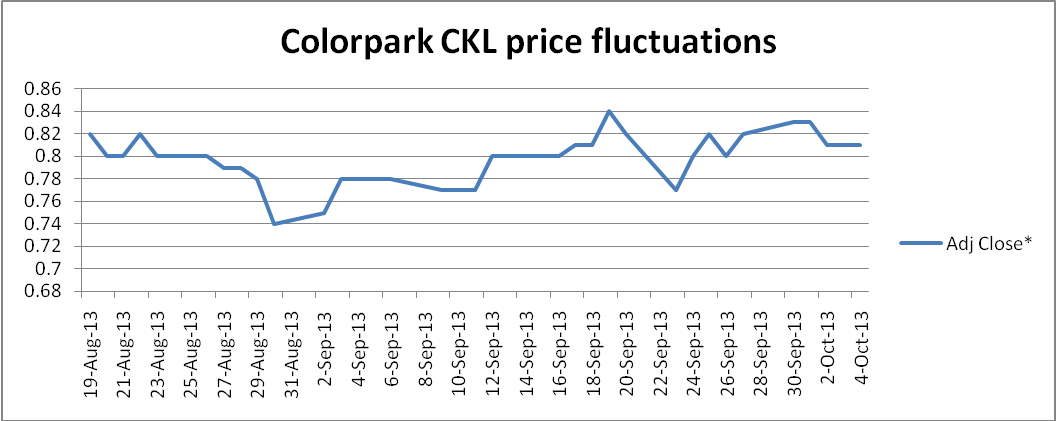
Colorpark paid annual dividends of $0.035 per share. It gives an annual dividend yield of 4.29%. EPS amounted to $0.0919. It had a net profit margin of 4.22% and return on equity of 10.79% (CKL: ASX, 2013). The return on equity is high enough to attract short-term investors.
CI Resources CII
CI Resources reported a net profit margin of 15.76% and an operating margin of 22.43%. Return on equity is at 21.76% and return on investment of 25.73% (CII: ASX, 2013). These are impressive financial indicators that would encourage shareholders to keep their stock.
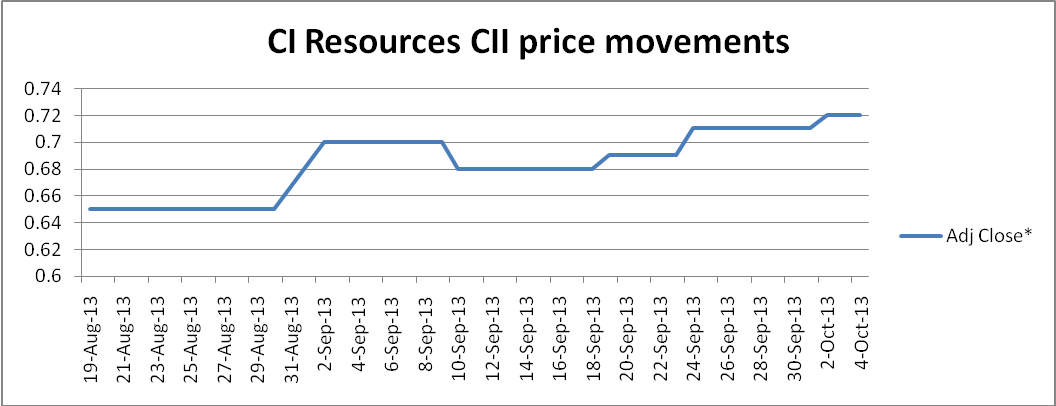
The good financial performance reports are followed by an upward trend in the graph of CII stock price. An investor holding the firm’s stock is less likely to incur capital losses in the short-term period. The stock price is volatile but generating gains.
Syrah Resources SYR
Syrah resources reported a net profit margin of -1,898.15%. Return on equity is reported at -16.62% (SYR: ASX, 2013). The high value in losses is as an indication of a large acquisition of reserve or other expansion activities. Investors are willing to pay a higher price for companies that invest in expansion and growth activities.
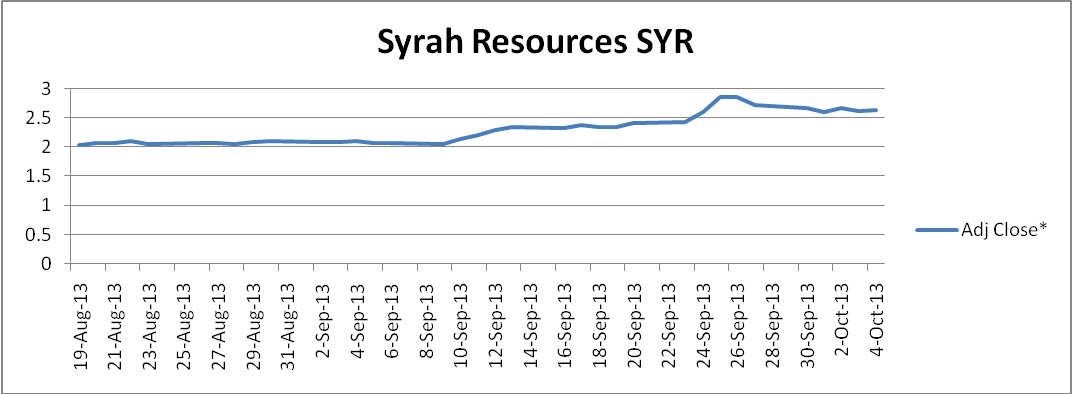
There is an upward movement in the graph with minor fluctuations in between. Once more, high financial losses are an indication of expansion. Investors are more confident holding Syrah stocks. Short-term investors gain from the confidence generated by shareholders and long-term investors.
Beta analysis
Brigham & Ehrhardt (2013, p. 251) explains that beta is calculated as shown below.
bi = (σi/ σM) σiM, where bi is the beta of stock i, σi is the standard deviation of stock i returns, σM is the standard deviation of the market return, and σiM is the correlation coefficient of stock i return and market return.
A high beta indicates a stock with a high risk. A stock’s return that correlates strongly with the market return will also appear to have high risk. Brigham & Ehrhardt (2013) explain that a beta of 1.4 would indicate a stock that increases risk by 40%. When the market is doing well, the stock does better. When it is performing badly, the stock performance will be worse. A beta of 1.0 indicates that all the variations in the stock price can be explained by variations in the overall market prices.
From calculations, Beach Energy stock gives a beta value of 1.14146. The beta reported by the Financial Times is 0.8569 (BPT: ASX, 2013). The calculated beta and the reported beta each indicated a value of approximately +/- 0.14 from the market trend. The absolute value of the variation is almost equal. In each case, it shows that 14% of the fluctuations in BPT Beach Energy stock prices do not follow the market trend. Risk increases as the beta value moves away from 1.0 which indicates the market trend. In the calculated case, shareholders may experience large capital losses when market indicates moderate capital losses.
Syrah Resources stock price has a reported beta value of 0.1332. The calculated beta value for the 2-month-period is 0.2428. It shows that the stock price varies widely from the market as someone continues to hold the stock for a longer period. In the calculated case, about 76% of the stock price does not follow market trends. In the reported case, about 87% of the stock prices are influenced by factors that do not influence the stock price of the general market. In the Syrah Resources case, the calculated beta and the reported one are almost similar in value. The difference may have been generated by differences in the length of time data is collected.
Table 3: Analysis of portfolio risk and returns
Portfolio risk and returns
Investor confidence in the macro economy can affect what investors are willing to pay for stock exchange. An economy experiencing a boom is likely to have gained in a majority of stocks (What drives stock prices, n.d.). Panic usually follows macro economic recessions. Its effect is lower stock prices for most stocks. Macroeconomic factors such as inflation, interest rates, and exchange rate have an effect on stock price. Macroeconomic factors influence market returns.
Interest rates may be significant if a company finances most of its operations on debt. Most mining companies use stock options to raise more capital at a lower cost. Companies involved in imports or exports may have fluctuated based on the exchange rate.
Stock prices fall when there are no signs of growth. Firms that operate in the mining industry have to keep large reserves of raw materials. Explorations have to be carried out continuously to ensure that depleted sites are replaced. Most of the materials sector companies above are performing well because of their continued expanding operations.
From the graphs above, companies that report large net losses still have capital gains because of reinvestment. Some of the companies that report high profit margins still have prices of their stocks fall. Some of the companies in the mining sector reported large losses but had stock prices rise include Syrah Resources, Sims Metal, and CuDeco Ltd. Some of the companies with positive net returns but had their stock prices fallen include Colorpark, and Drillsearch Energy.
Summary of the gains and losses
Stocks of companies in the energy sector performed poorly compared to those in the materials sector. The stock investments in the energy sector generate a net loss of $2,418.88. On the other hand, the value of stocks invested in the materials sector generated a net gain of $7,763.94. Three out of five companies in the energy sector had the market value of their stock fall. Only Colorpak stocks performed poorly in the materials sector. The overall investment generated positive net earnings amounting to $5,345.06. It can be considered as a good investment decision.
Syrah Resources performed the best followed by CuDeco stocks in generating net earnings. Syrah Resources have generated net earnings amounting to $3,624.62 and CuDeco has $2,599. Syrah Resources has the highest net loss margin of 1,898%. The company has invested largely in growth opportunities that investors perceive will generate higher net gains in the future. Its beta indicates that it may gain value when the overall market loses value. Its graph is fairly stable with a smooth upward trend (see graph 10). CuDeco stock price has a similar trend (see graph 6). The price is moving upwards continuously. It also reports large net loss margins of 111.03%. It shows a firm that engages operations associated with growth. From these two stocks, foreseen company growth opportunities have a high ability to make stocks perform better rather than high net profit reports. However, net losses without expansion could result in worse stock performance.
The stock that generated the highest loss is Drillsearch Energy stock despite the fact that it reported a high net profit margin of 44.08% (DLS: ASX, 2013). Financial Times reports indicate that it has a beta value of 2.15. It shows that it may record wide fluctuations from different from other stocks in the ASX. A high beta value indicates a high risk as it can be noted in Drillsearch Energy stock performance.
Better performance in the form of increasing revenues and profits may cause stock prices to rise. Increased profits without growth opportunities do not assure an increase in the price of stocks. Investors will be willing to pay more for stocks of firms with good financial performance. Long-term investor may be interested in EPS and shared dividends. Sustainable high dividends and EPS may increase the market value of stocks. Sustainability ensures that reported profits will last for a longer period.
Reference List
BPT: ASX. (2013). [Press release]. Web.
Brigham, F.E., & Ehrhardt, C.M. (2013). Financial management: theory and practice. Mason: South-Western Cengage Learning.
CDU: ASX. (2013). [Press release]. Web.
CII: ASX. (2013). [Press Release]. Web.
CKL: ASX. (2013). [Press release]. Web.
CTX : ASX. (2013). [Press release]. Web.
DLS: ASX. (2013). [Press release]. Web.
JPR: ASX. (2013). [Press release]. Web.
SYR: ASX. (2013). [Press release]. Web.
What drives stock prices. (n.d.). Web.
ZNZ: ASX. (2013). [Press release]. Web.