In 2008, the annual consumption of Saudi Arabia cement was 30 million tones, this figure rose by a 6.7 million margin through the year 2009 to give an annual consumption of 36.7 million tones. This increase in consumption saw the Saudi Arabia cement industry grow by 22% in 2009. Both of these facts are indications of quite a strong performance by the industry in the year 2009 (BMG Financial Group, 2010, 1). The cement industry in Saudi Arabia serves the central region, the eastern region and the western region. During 2009, the central region favored the industry since demand driven construction activities in this region saw local consumption of cement grow by a robust 40%. The eastern region significantly influenced by global trends and did not significantly promote growth in the industry due to the global slowdown. Still in the same year, the western region had its mega construction activities delayed and thus denying the industry a good year.
Problems in the cement industry in Saudi Arabia are arising from over capacity and new entrants into the industry should be aware of these. In 2009, cement over supply in Saudi Arabia was estimated at about 2 million tones. Given that, it is illegal to export cement from Saudi Arabia this excess cement the strategy has been to re-direct it into the local market. The implications of this redirection generally mean that industries have to deal with falling prices of cement and reduced revenues (BMG Financial Group, 2010, 1).
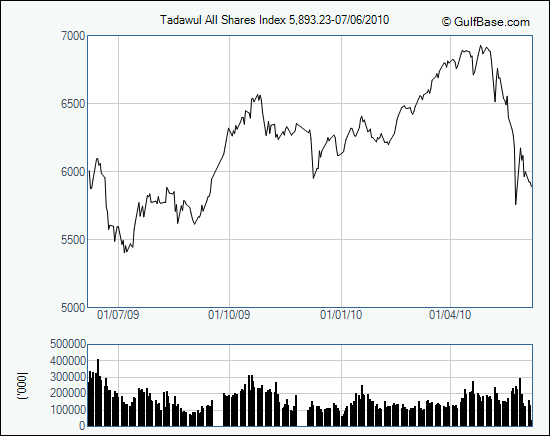
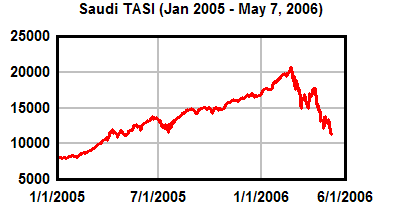
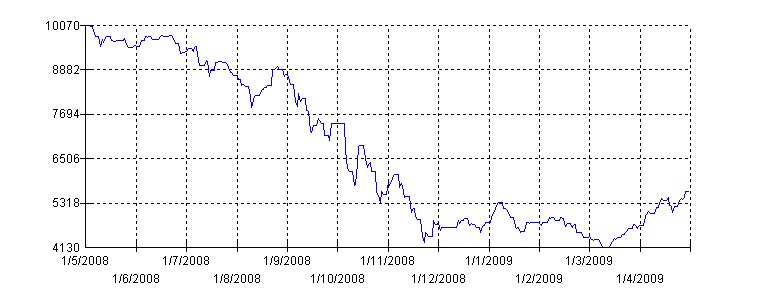
According to the TAWADUL –Saudi Stock Exchange- stock reports on June 6, 2010 at 15:54:59 the value of the cement index was 3769.50, which is a 1.07% increase (Saudi Stock Exchange, 2010). This value places it sixth in the overall index standings, which is a good indicator that the cement industry is large and very vibrant in Saudi Arabia. Some of the major players in the Saudi Cement industry include; Arabian Cement, Yamama Cement, Qassim Cement, Yanbu Cement, Saudi Cement, Eastern Cement, Southern Cement and Tabuk Cement. The following graphs show some facts of Tadawul investment details


Saudi cement industry according to market analysts has been demand driven, with an oversupply of the products to meet the demand. According to BMG financial group, (2010) the performance of cement industry in Saudi is reporting annual growth for 2009 vis-à-vis 2008 with reference to cement tonnage capacity. Annual revenue margins posted for this two years is indicative of this. The cement products have posted an annual growth of about 22%. In terms of geographical coverage operations, domestic consumption especially in the central region has had relatively impressive records in amounts handled as well as how the industry has grown. Based on how the cement-based projects in 2009 have performed in the eastern and western region, their activities were relatively not robust. Inception of some key projects in the Western region has been late than supposed (BMG financial group, 2010, p. 1). Currently, illegalizing of cement exportation is an indicator of the current and future expectation on growth of market demand for cement products. Anyway, the ban will significantly increase the local oversupply of the cement. However, this has hurt the export earnings. The cement industry seems to be inclined on boosting local volumes transacted at the expense of the export trade. According to BMG financial group, (2010) the cement companies in Saudi Arabia when ranked against other reputable eighteen Asian cement operators based on multiple market price earnings (for projected years between 2010 and 2012) a Hong Kong Cement Company (Anhui Conch) topped the list followed by three others from Indonesia, India and Taiwan respectively (p. 3). Those from Saudi Arabia ranked fifth, sixth, seventh, eleventh, Fourteenth, and fifteenth. These companies were as follows as arranged in the order occurrence: Eastern Cement, Qassim Cement, Saudi Cement, Yamama Cement, Yanbu Cement, and Arabian Cement. Egypt cement operators were also in the rankings. In spite of the Eastern Cement operator, volumes sold being higher for the 2009 as compared to 2008 by about a hundred thousand tones; their selling price per ton had receded by SAR12. In addition, their operations were lower by 14% than the 2008 capacity; annual revenues similarly dropped by SAR 19million. The similar downturns resulted in the annual gross profit margins and net incomes for the years 2008 and 2009 when compared. The net income difference was up to SAR83million. Qassim Cement operator annual volume sales difference between 2008 and 2009 were positive at 1.1 million tons (BMG financial group, 2010). Their cement sales were mainly to the local markets. The company expanded by about 20% in 2009 results with annual revenue rising by SAR167million. However, profitability levels and gross profit margin fell relative to 2008 for 2009. Annual net income rose by 15.9% in 2009. Saudi Cement operator annual revenues rose to 6.8% for 2009. Annual net income and gross profit margin declined by 5.3% and 5% respectively in 2009. A cement enterprise player called Arabian with its operations intends to capitalize on its production operations in Jordan arguably to boost its volume of cement supplied within and to Saudi (BMG financial group, 2010, p. 4). Based on the BMG financial group report released, this facility is expected to operation towards the mid of 2010. The predicted gross margins for the Jordan facility imply to supplement/compliment cement production for the Saudi facility, if not foster competitive operations between the two sister facilities. The Jordan facility named as the Al Qatrana Cement, with projected gross margins of 30%. Over and above, the Arabian Cement 2009 financial year had increased volume sells as compared to the previous years.
Thus, the impressive market reports are an indication of their 2010 anticipations and potential of posting relatively similar or better financial returns from their operations. Other than, cement Volumes transacted, their revenue returns were significantly positive for the year 2009. However, their net income dropped by 46.9% relative to the 2008 earnings (BMG financial group, 2010). Yamama Cement operator annual sales volume rose by 1.1tonnes but on aggregate the selling price per tone was down by 13% at SAR224 a ton in 2009 (BMG financial group, 2010). In 2009, the company sales concentrated on the local markets for their cement products. Annual revenues for the cement operator in 2009 rose to SAR1, 163million but the gross profit margin fell toi 59.3%. Yanbu cement operator annual revenue earnings and net income for 2009 fell by 13.7% and 13.9% respectively. However, surprising their net profit projected was up by 2.3%. Yanbu Cement operator was ambitious by approving dividend per share of SAR3 that makes up to 6.3%. Their operations target the western region.
According to Articles Hub website article Saudi Cement Companies Demand Removal of Export Ban (2009) cement companies are prefer the export ban in place to be lifted to rid remaining stock while improving profit earnings. The article further states that Saudi’s National Commercial Bank stated that of the over ten cement operators production output on average reaches at almost 50miliion tones yearly. The Saudi cement manufacturers collectively sold a close 16.5 million tones but were lower than the previous year by 0.5%. The manufacturers argue that the export ban resulted to this sales drop. In addition, in 2008 when the ban was inexistent exports led to relatively raking more profits compared to 2009 case. The poor price of cement products in 2009 resulted from introduction of new cement companies that flooded the domestic market.
One place where information is available regarding the Saudi’s cement industry is the Saudi’s stock exchange. Information from this source can include the size and vibrancy of the industry, the major players or major companies in the industry. From the Saudi’s Stock Exchange (TAWADUL) an investor can determine the best company to buy stock from, that is, stock with a buy rating. The Capital Market Authority of Saudi Arabia is responsible for supervising the operations of the Saudi stock exchange. Cement companies that had registered with the Saudi Stock exchange as of 30 April 2008 are Arabian Cement, Yamama Cement, Qassim Cement, Yanbu Cement, Saudi Cement, Eastern Cement, Southern Cement and Tabuk Cement. The Saudi Stock Exchange has its website where all these information is readily available. Articles on gazettes, e.g. the Saudi Gazette, also give information concerning trends that are relevant to the industry. Individual companies such as those mentioned above also provide information on the industry through their respective websites. Independent research organizations also provide information on the industry. The NCB Capital Equity research firm provides a quarterly monitor of the industry that gives information on price realizations, efficiency grid, valuation and sales and inventory news (NCB, 2008, 1-5). For instance, in one of its quarterly monitors, NCB (2008, 1) it reveals a decline in price realizations among the various companies in the sector in the third quarter of the year 2008. It continues further to state that the price realizations during this period averaged at an amount of $ 69 per tone and that same quarterly monitor goes on to reveal that revenues also fell in the same period (2008, 1).
The topic Shares Outstanding (2010, 1) defines shares outstanding as the stock that is held by investors. These investors include the public, company’s officers and insiders. According to the topic Market Capitalization (2010, 1), market capitalization is a term used in investment to refer to the figure gotten from the product of the total number of shares outstanding and the stock price per share. The market Capitalization value of a company form (among other) tools, that can weigh the value of the company with regard to the stock market American Portfolios, 2010). Enterprise value as explained in the topic Enterprise Value (2010, 1) is a measure of a company’s value that is commonly used as an alternative of the market capitalization value. The term turnover as used in stock market operations is defined in the topic Turnover (2010, 1) as the number of shares traded in a given period as a percentage of the total shares in a given exchange or portfolio.
Let us consider stock from Arabian cement, Yamama cement, Qassim Cement, Yanbu Cement, and Saudi cement. These five companies were the top five performers in the Saudi Cement industry in the year 2009. According to the results released by the Arabian Cement company in the 2009 financial year, year- on-year revenues grew by 2.2 %, the company sold 2,975,000 tons of cement locally, the company’s clinker inventory rose to 519,000 tones; it yielded a gross profit margin of 52.9% and registered a net income drop of 46.9 % (BMG Financial Group, 2010, 4). The company is expected to increase its production to up to 5.3 Million tons per annum. Arabian Cement company stock is considered a long-term buy owing to the developments in terms of expansion and larger production volumes (BMG Financial Group, 2010, 4). The company had a market capitalization of SAR 3.44 billion (US $ 0.92 billion), an enterprise value of SAR 4.72 billion (US $ 1.26 billion dollars) and it had an outstanding value of 80 million shares with an average daily turnover of SAR 3.74 million. In a 52-week period, the shares traded at a low of SAR 31.60 and a high of SAR 50.00. As a financial adviser, I would recommend to my client that she purchase Arabian stock because they exhibit a potential to increase in value in the future.
According to the results released by Saudi Cement Company in the 2009 financial year, year- on-year revenues grew by 6.8 %, the company sold 5.6 Million tons of cement, the company has a clinker inventory of 2.8 Million tones, and it yielded a gross profit margin of 51% and registered a net income drop of 5.3 % (BMG Financial Group, 2010, 7). Investors in Saudi Cement company stock are prior informed on the sale of their stock given that the company is facing difficulties arising from the export ban imposed by the Saudi government (BMG Financial Group, 2010, 7). The company had a market capitalization of US $ 2 billion (SAR 7.32billion); an enterprise value of US $ 1.26 billion (SAR 8.35 billion) dollars and the number of outstanding shares was 102 million shares with an average daily turnover of SAR 7.1 million. In a 52 – week period, the shares traded at a low of SAR 46.30 and a high of SAR 75.50. As a financial adviser, I would advise my client that not to make purchases at the current in the Saudi Cement stock at least not yet because a lot is not working for the company at the current.

According to the results released by Qassim Cement Company in the 2009 financial year, the company’s turnover amounted to SAR 987 million that represented a year- on-year growth of 20 %. The company reportedly sold 4.3 Million tons of cement at an average selling price of SAR 231, the company has a clinker inventory of 301760 tones, and the company’s gross profit margin dropped to 58% and registered a net income of SAR 602 million that was an increase of 15.9 % (BMG Financial Group, 2010, 6). Market capitalization for the company stood at a value of SAR 6.9 billion (US $ 1.8 billion), it had an enterprise value of SAR 6.5 billion (US $ 1.7 billion dollars) and the number of its outstanding shares amounted to 90 million shares with an average daily turnover of SAR 13.3 million. In a 52-week period, the shares traded at a low of SAR 38.00 and a high of SAR 77.50. Even after new capital was injected into the company from lawsuits it had filed on suppliers and contractors the company went on to record an in profits. Investors in Saudi Cement company stock would be in a better position if they sold their stock. As a financial adviser, I would recommend to my client that she does not purchase Qassim Cement stock because the company appears to be bracing itself up for better times in the future.
According to the results released by Yanbu Cement Company in the 2009 financial year, the company’s turnover amounted to SAR 943.2 million that represented a year- on-year drop of 13.7 %. The company’s sales dropped by 9.3% to 3.9 Million tons of cement, the company recorded an EBITDA margin dropped of 61.9 and registered a net income of SAR 482.1 million that was a year on year drop of 15.9 % (BMG Financial Group, 2010, 9). Market capitalization for the company stood at a value of SAR 5.0 billion (US $ 1.3 billion), it had an enterprise value of SAR 4.9 billion (US $ 1.3 billion dollars) and the number of its outstanding shares amounted to 105 million shares with an average daily turnover of SAR 4.6 million. In a 52-week period, the shares traded at a low of SAR 35.40 and a high of SAR 56.75. The company did manage to display operating efficiency even after a decrease in the average annual price of cement. The company has also taken up a loan, which it will use in its expansion project that is expected to be fully functional by January 2012. Investors holding Yanbu Cement company stock would be in a better position if they too sold their stock (Calstrs, 2010). My financial advice to my client would be that she purchases Yanbu Cement stock this is because expectations are that the stocks shoot up in value when its expansion projects are complete in the western side of Saudi Arabia.
According to the results released by Yamama Cement company in the 2009 financial year, the company’s turnover amounted to SAR1163 million which represented a year- on-year growth of 3.6 %. The company managed to sell 5.2 million tons of cement at an average selling price of SAR 224, the company’s gross profit margin dropped to 53.3% and registered a net income was of SAR 562 million which was a year on year drop by 8% (BMG Financial Group, 2010, 8). The company’s Clinker inventory rose to 1,034,000 tones.Market capitalization for the company stood at a value of SAR 7.0 billion ( US $ 1.9 billion), it had an enterprise value of SAR 7.0 billion (US $ 1.9 billion dollars) and the number of its outstanding shares amounted to 135 million shares with an average daily turnover of SAR 7.2 million. In a 52-week period, the shares traded at a low of SAR 28.30 and a high of SAR 53.50. The company did manage to display operating efficiency even after a decrease in the average annual price of cement. The company has also taken up a loan that it will use in its expansion project that it anticipates to be fully functional by January 2012. Investors holding Yanbu Cement company stock would be in a better position if they too sold their stock. My financial advice to my client would be that she purchases Yamama Cement stock this is because the stock has exhibited a lot of stability in the market.
Of the three stocks recommended, that is, Arabian Cement stock, Yanbu Cement Stock and Yamama Cement stock I would further recommend that, of these three she invests in Yanbu Cement Stock. This is because it is relatively strong stock in the TADAWUL compared to the others as shown by its trading low of SAR 35.70 and high of SAR 56.75.
References
American Portfolios. (2010). American Portfolios Financial Services. Web.
BMG Financial Group (2010). Saudi Cement Sector. Web.
Bumfrey, R. (2010). Investment news. Web.
Calstrs. (2010). Investment. Web.
Gulfbase.com (2010). Middle East at Crossroads. Web.
NCB Capital (2008). Saudi Arabia Cement Sector. Web.
Saudi Stock Exchange (2010). Stock Exchange. Web.
Web log. (2006). Stock markets Continue to fall worldwide. Web.