Introduction
The specific evidence of the possible effect of economic bubbles on the prices of banks’ stock in Saudi Arabia can be observed from the analysis of weekly stock prices of the three major banks of the country, i. e. Riyad Bank, SAMBA, and Saudi Fransi Bank (or Banque Saudi Fransi). The usefulness of such an analysis is in formulating the proper Buy and Hold investment strategy.
Banks’ stock prices analysis
Riyad Bank
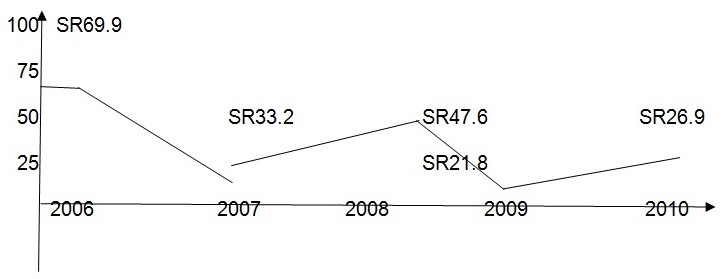
So, the first Saudi bank that should be analyzed for the purposes of further investigation is the Riyad BankThe bank has 1.5 billion shares outstanding, while the value of EPS (earnings per share) is at the level of SR2.18 and the dividend per share amount to SR1.40 (Bloomberg Businessweek, 2010). The weekly stock prices of the Riyad Bank are illustrated by Graph 1:

Thus, the above graph reveals the four distinct periods in the stock price dynamics of Riyad Bank, i. e. the decline of prices in early 2006, the sharp growth of prices that took place in early 2008, a decrease of prices in late 2008, and the new price growth, which is still observed starting from January 2010.
The price – earnings ratio (PER) reveals that such dynamics of Riyad Bank stock prices is directly proportionate to the number and effect of stock market bubbles observed in the Sauid economy in the respective periods:
- PER = Stock Price / EPS
- PER 2006 = 69.9 / 2.49 = 28.1
- PER 2007 = 33.2 / 2.40 = 13.8
- PER2008 = 47.6 / 2.86 = 16.6
- PER 2009 = 21.8 / 2.00 = 10.9
- PER2010 = 26.9 / 2.18 = 12.3
Thus, the PER values for the discussed periods reveal that stock market bubbles have considerable negative effects on the stock prices of banks on the whole and Riyad Bank in particular (Engsted, 2004, p. 21).
SAMBA
The data for the SAMBA bank, one of the largest Saudi banking institutions, interestingly reveal quite similar facts regarding the stock prices’ dynamics and bubble effects on the markets (SAMBA Financial Group, 2010):

The first implication of the above graph is the similar shape of the curve that reflects stock prices’ rises and falls. Secondly, the PER for SAMBA displays the same price dynamics, although the EPS for this bank is more than twice as large as for Riyad Bank, i. e. SR5.00:
- PER 2006 = 127.3 / 5.8 = 21.9
- PER 2007 = 86.5 / 5.3 = 16.3
- PER2008 = 118.7 / 4.9 = 24.2
- PER 2009 = 53.3 / 5.1 = 10.5
- PER2010 = 61.3 / 5.3 = 11.6
Accordingly, the values of PER for SAMBA quite similarly reflect the picture of stock market dynamics under the effect of the stock market bubbles that accrued in early 2006 and late 2008 conditioned the sharp decline trends in the Saudi stock market. Interestingly, the period of the growing numbers of economic bubbles in the Saudi economy, as well as possible in other economies around the world, coincided in time with the global economic recession. Another view might be that stock market bubbles not only have negative effects on the stock prices of banks but can on the whole be harmful to the country’s economy (Gilchrist, 2005, p. 826).
Saudi Fransi Bank
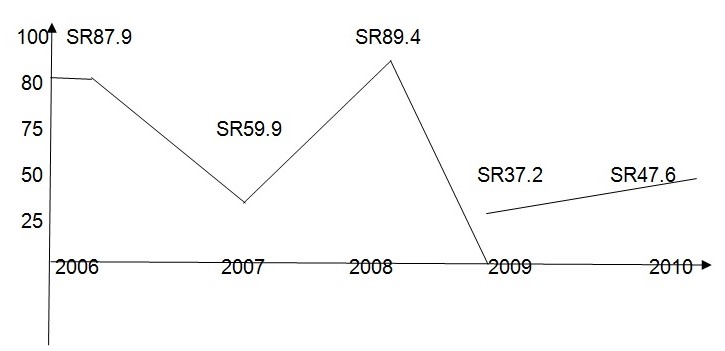
Finally, the data collected from reputable sources on Banque Saudi Fransi reveal that this bank was not an exception in the general stock market trends observed in the period between 2006 and 2010.

The above-presented analysis of Riyad Bank and SAMBA data allows assuming that the decrease of Banque Saudi Fransi’s stock prices was also conditioned by the stock bubbles, whose growth periods are early 2006 and 2008 (Bloomberg Businessweek, 2010).
The interesting peculiarity of Banque Saudi Fransi revealed by the above graph is that the decrease in stock prices conditioned by the economic bubbles’ development was rather drastic if compared to the other two banks analyzed, but the period of prices’ recovery is still expected to begin. In Riyad Bank and SAMBA, stock prices started growing from early 2010, while in Banque Saudi Fransi this growth is hardly noticeable – SR37.2 for 2009 compared to SR47.6 in 2010 (Banque Saudi Fransi, 2010). The PER values also prove the above point:
- PER 2006 = 87.9 / 3.00 = 29.3
- PER 2007 = 59.9 / 4.82 = 12.4
- PER2008 = 89.4 / 4.99 = 17.9
- PER 2009 = 37.2 / 5.01= 7.4
- PER2010 = 47.6 / 3.38 = 14.1
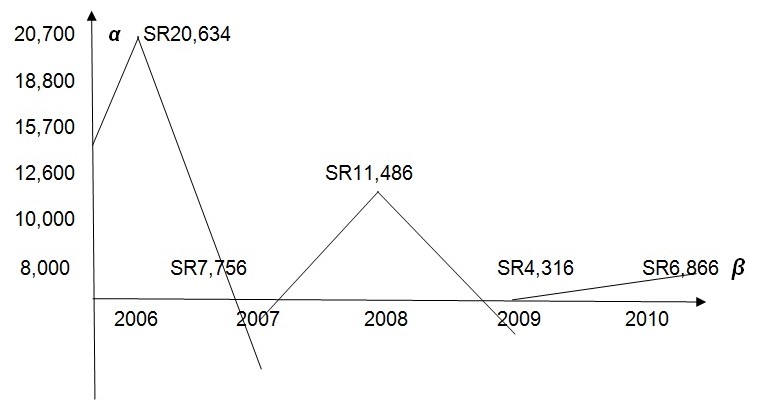
Thus, the data for the third bank under analysis also reveal that the economic bubbles have a negative effect on the stock prices in the Saudi stock market. The following figure (Graph 4) illustrates the general dynamics of stock prices in the Saudi Arabian stock market in the discussed period between 2006 and 2010. In particular, this graph allows monitoring of the development, burst, and effects of the two stock bubbles observed in the mentioned market during the mentioned period. The two stock bubbles in question are the one that took place in February 2006 and the one that lasted for almost the complete year 2008 and early 2009:

The fact is also proven by the following regression:
- Y = α + βX + ε
where α represents the average stock prices, while β is the reflection of the actual prices, and stock bubbles, observed between 2006 and 2010. Thus, if the regression is used to calculate the actual market prices’ dynamics, if will take the following form:
- Y = 7,756 + (6,866 x 0.448) + 0.5
- Y = 7,756 + (6,866 x 0.448) + 0.5
- Y = 7,756 + 3,076.4 = 10,832
Thus, the regression shows the average stock price at which the Saudi market would not experience drastic rises, but will not be exposed to bubble bursts and their effects either.
Conclusion
So, the whole above presented analysis reveals the great effect of economic, specifically stock market, bubbles for banks’ stock prices’ dynamics in Saudi Arabia. This fact allows claiming that investors looking for minimal risks in their projects are not advised to invest money into the Saudi markets. On the other hand, investors trying to find the most profitable projects, although at high risks, can use the bubble effects to retrieve profit using the buy-and-hold investment strategy.
Works Cited
Banque Saudi Fransi. Official Corporate Web Site. RIBL, 2010. Web.
Bloomberg Businessweek. Commercial Banks Industry: Riyad Bank, SAMBA, and Saudi Fransi Bank. Financials Sector, 2010. Web.
Gilchrist, S. “Do stock price bubbles influence corporate investment?” Journal of Monetary Economics 52 (2005): 805 – 827. Print.
Engsted, T. “Speculative bubbles in stock prices? Tests based on the price-dividend ratio.” Working Paper Series No. 173 (2004): 1 – 25. Print.
Riyad Bank. Official Corporate Web Site. RIBL, 2010. Web.
SAMBA Financial Group. Official Corporate Web Site. SAMBA, 2010. Web.