This paper will analyze articles that relate to the recession, GDP, inflation, unemployment, derived demand, and housing starts. These analyses are related to the current situation of the US economy.
According to Mankiw’s textbook, a recession is defined as a phase of negative GDP growth usually within two consecutive quarters. During this time the GDP growth expressed as a percentage is usually negative. Mankiw’s textbook states that a recession is caused by a shift in the aggregate demand curve. When there is a fall in general demand, firms are forced to reduce their operations and at times even close down the business. This leads to inefficiency in the economy. The problem is cyclical in that unemployment means that households have less disposable income hence the aggregate demand in an economy remains low. Governments are faced with the obligation of fighting both the possibilities of a recession and ensuring that there are enough employment opportunities for the people.
In article # 5, Uchitelle states that 524,000 jobs were lost in December alone when there was still uncertainty over the status of the US economy in terms of being in a recession or not. In January this year, article # 1 Dougherty reports that another 600, 000 were lost. This indicates the fact that firms are scaling down their operations to cut down costs as a result of a decrease in demand. Mankiw textbook states that a shock in the aggregate demand is usually triggered by an unprecedented negative occurrence on the supply side. The majority of Americans believe that the current recession was triggered by the 2008 global hike in energy prices while economic analysts believe it is a culmination of a long period of poor regulation of the financial market.
Due to a recession, there will be a negative response on aggregate demand that might be caused by several factors. Article # summarizes them as:
- Shortage of finance
- Falling house prices – shortage of mortgages and finance.
- Cost-push inflation decreasing income and reducing disposable income.
- Lower confidence in the finance sector. For example, some bank has already closed down (causes of recession, 2009).
Therefore, those four factors have impacted negatively aggregate demand (AD) which is constructed of consumption by households, investment, government spending, and exports fewer imports and thus a change in any of its components means that it shifts. In figure 1, it is indicated by the shift of AD1 to AD2, and GDP will consequently fall from G1 to G2
The slope of AS determines the change in G. If there is a fall in AD represented by a shift, then there will be a fall in Real GDP. If there is a vertical AS curve, AS curve means that the economy is operating at full capacity and 100% utilization of all resources. Thus, a change in demand would only mean a slight change in real GDP. This should be the trend that the US economy expected, a change in AD would only mean a slight change in real GDP, but this has not become the trend yet.
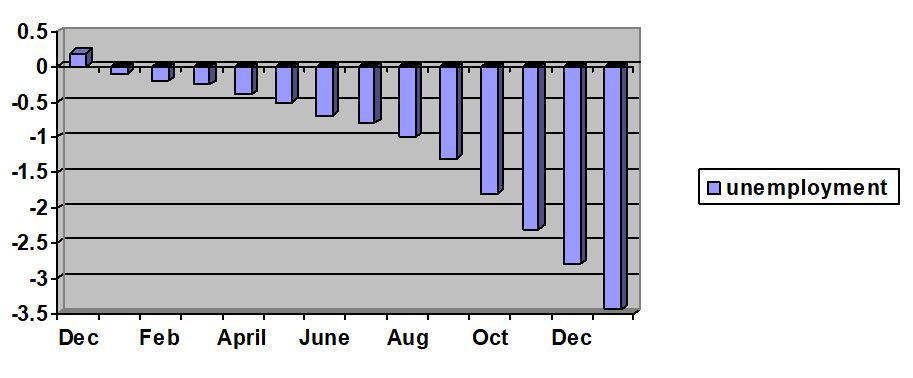
A fall in Real GDP will be temporary as labor markets will tend to adjust to new price levels in a short period. In article # 5, Uchitelle says that 2.59 million jobs have been lost so far. However, the Wall Street Journal, in article # 1 (Dougherty, 2009) offers a more recent figure of 3.6 million lost jobs since the recession began in December 2007.

The above graph displays the situation as it is which is similar to the Great Depression in 1930. What is happening now is a model of the events that happened following that event. However, the current situation has been blamed seriously on the financial market. As a result, firms are doing exactly what was being done by the existing firms early than; cutting down operations cost through employees layoff.
Moreover, some firms have resulted in changing their employee’s work hours instead of laying them off entirely. This is bad for part-time workers. In addition to this, firms have preferred part-time employees to full-time employees. Article # 5, says “Nearly as troubling, hundreds of thousands more people sought full-time work in December but could not get more than part-time jobs.” Therefore, the number of unemployed could swell to 13.5% according to article #5 if the part-time workers were to be considered as unemployed. According to article # 1 states that takes the estimate a little bit higher at 13.9%.
People are worried about the current recession and unemployment levels, and the fact that the service industry is somehow affected; this is not a good sign. Article #1 says that a recession would be most expected to be visible through the cutting of production but not by the fall in ordinary consumption of goods and services. “The service sector, which accounts for around 85% of jobs and includes everyone from lawyers to massage therapists, lost 279,000 jobs in January.” (From article #1)
Chris Rupkey, a chief financial economist with Bank of Tokyo-Mitsubishi UFJ in New York is quoted by Dougherty from article # 1 saying that the “These job losses are such that it’s going to be hard for the economy to regain its footing until 2010.” This is the most worrying thing to consumers and firms; there is no visible sign of immediate recovery despite the stimulus packages.
Dougherty from article # 1 reports that there were 600 000 job cuts in January of this year alone. He says that such massive layoffs have triggered the enactment of a second stimulus bill after the first one signed by Bush in 2008 proved not enough to save firms. In January, unemployment levels were at 7.6%. There are two possible reasons that the current unemployment levels remain relatively high from article # 3; there has been an increase in the number of people who choose not to work and enjoy social security benefits and people who are not actively searching for employment but need one.
Increased unemployment and the “panic” overspending have seen house prices fall. The unavailability of finance, as one of the factors that have triggered a recession has meant that there is a very low demand for houses. As a result, demand for building materials, house insurance, and anything related to the building and construction industry has gone down. The demand for such goods and services is derived from the demand for houses which is directly related to the levels of income by the working class. Article # 4 reports that the rate at which house prices are falling is alarming. “Nevertheless, all the reporting agencies are concluding that the number of sales of single-family homes in 2008 was down from 2007 in the New York metropolitan area, and prices in general were down.” (from article # 4)
Negative GDP growth is what is considered to be a recession as earlier said. According to the Mankiw textbook, the GDP of a given economy is the total monetary value of all the economic activities taking place in that country. It is expressed as
GDP (Y) = C + I + G + (X − M).
C=Consumption (70%)
I=Investments (15%)
G=Government expenditure (20%)
X=Exports (-5%)
M=Imports (-5%)
The federal government is thus making attempts to influence the growth of the GDP. According to the above formula, consumption by households in the US and government spending are viewed to be the key to delivering the country from its economic crisis, because there is 70% in consumption by households, and 20% in government expenditure. The government is playing its role through economic stimulus bills. These bills are meant to inject more money into the economy and thereby influence aggregate demand.
The increase in money supply is aimed at providing money to households and firms to encourage them to spend and thus trigger an increase in aggregate demand that will increase the growth of the economy. On the other hand, the excess money supply in an economy leads to inflation. While inflation is viewed as just the general increase in the price level, the Mankiw textbook says that the problem runs deer but the price increase is the most visible sign.
Government attempts to jumpstart the economy through stimulus bills will in the short run increase the money supply. An increase in money supply leads to growth of the economy in the long run indicated by a rise in GDP levels. With the US economy being in a recession, it is expected that the government will follow the regulation, which advocates for government intervention to boost the economy, by increasing government spending. However, the relationship between money supply and GDP is loose due to instability on the demand side of money. This simply implies that the increase in money supply through the stimulus bill will not necessarily be reflected in the GDP or the overall improvement in the economy. Another method is lowering interest rates and offering tax rebates which also inject money into the economy by the government. And inflation may provide a distorted view of the economy as the nominal GDP does not account for inflation. Thus, adjusting the nominal GDP to inflation gives real GDP a more reliable indicator of economic progress.
Formula for Nominal GDP= △P*△Q
The formula for Real GDP= base year Price *△Q
Inflation on another note means that the high increase in price levels results in higher production costs for firms. As a result, firms will hold back their production capacity as raw materials become more expensive. Consequently, firms will lay off employees to keep down their costs of production. As a result, economists have come to draw the relationship between unemployment and inflation.
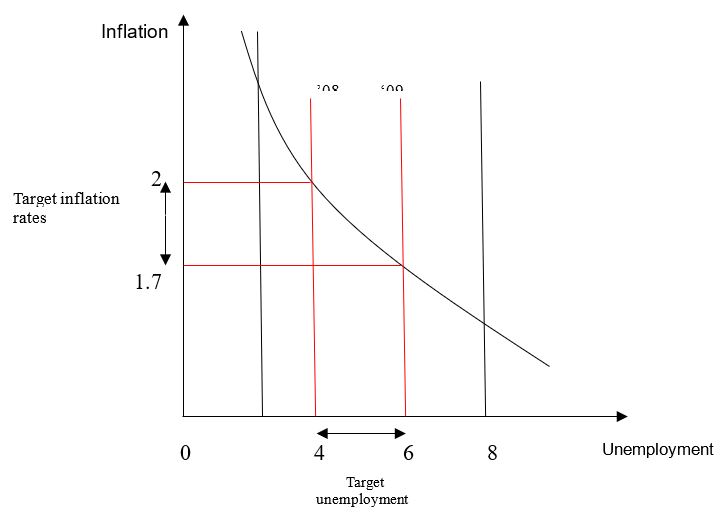
Assuming that the Federal Reserve System targets to contain inflation at between 1.7% and 2%, while inflation is targeted between 4% and 6%, then the Phillips curve would appear as below.

Mark Zandi is again quoted by Healy from article # 2 who says that “A bit of inflation is encouraging. It means businesses aren’t completely giving up and slashing prices.” Therefore, while excessive inflation is feared its opposite referred to as deflation is also feared and has also negative effects on the economy. Article # 2 reports that the last few months of 2008 witnessed falling house prices at an annualized rate of 12.7%. We are not sure whether this means that consumers could afford more than they did previously or not? To have a better grasp of what such a scenario means, we look at the Consumer Price Index.
The CPI is a measure of the cost of goods purchased by the average U.S. household compared to given prices in a base year. The goods henceforth regarded as a basket of goods consists of the most common goods and services to an average consumer. It contains elements such as healthcare, education, and food. “The Labor Department reported that the Consumer Price Index for January rose a seasonally adjusted 0.3 percent after a decline of 0.8 percent in December.” (From article # 2). The fall in energy price has impacted positively on the economy as households have more money at their disposal.
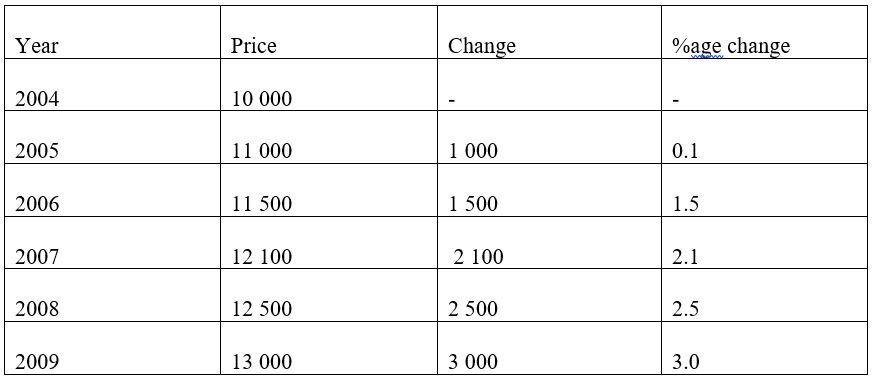
Assuming the price of an average house several years ago was 10, 000 dollars, we can calculate the change in consumer price index going by assumed price change over the years to the current assumed price of 13, 000.

A base year is used because seasonal price changes have a propensity to cause momentary fluctuation in the price of goods without automatically creating inflation. Therefore, the indication of inflation is best captured by comparing CPI over a long period.In calculating the CPI, a base year is used from which change in prices of a particular basket of goods is referred to. If the index number increases exceptionally, it means that the cost of living is going up and therefore we have inflation, which in turn prompts the government through Federal Reserve to take appropriate measures to control it. From the graph, is shown that June and July had very high levels of inflation.
References
Articles
- Dougherty, C. (2009). “Soaring Job Losses Drive Stimulus Deal”, Wall Street Journal. Web.
- Healy, J. (2009). “Energy Costs Push Up Consumer Prices in January”. New York Times. Web.
- Melloan, G. (2009). “Why ‘Stimulus’ Will Mean Inflation”,Wall Street Journal. Web.
- Patterson, M. (2009). “Trapped in Their Own Homes”, New York Times.
- Uchitelle, L. (2009). “Jobless Rate Hits 7.2%, a 16-Year High”New York Times. Web.
- “Unemployment” (2009), New York Times. Web.
- Causes of recession (2009). Web.
Books
- Mankiw, G. (2006). Principal of Macroeconomics. Fourth Edition, New York: Worth Publishers.