For Major League Baseball (MLB), payroll amounts relate to team wins. While introspecting the MLB game phenomenon, Killins (2014) established that there is a strong relationship between payroll and amount and team wins. Applying regression techniques by drawing a scatter plot of real-world data of MLB payroll amounts (independent variable) and win totals (dependent variable) copied to the Excel spreadsheet, it is practical to establish the nature of the relationship between the two variables.
Comparing Least Square and Linear Regression Models
Least square regression is a technique of estimation, which allows analysts to predict the parameters of the models. For example, OLS models are a models applied when estimating the parameters of linear regression models. On the other hand, a linear regression model is a technique applied in joining a set of distributions that satisfy a set of postulations. These models are both used in predicting independent variables.
Scatter Plot and Linear Regression Model
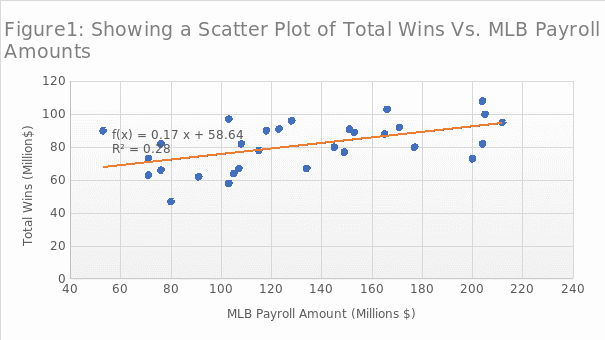
The scatter plot in Figure 1 represents the values of total wins as an independent variable, while MLB payroll amounts are considered dependent. In addition, the chart in Figure 1 displays a linear regression model, which explains the relationship between payroll amounts and total wins, as shown in Equation 1. The model is used in calculating predicted win totals and associated residuals. The coefficient of correlation squared is provided alongside the linear regression model. To find the correlation coefficient, the analyst obtained the square root of ![]() . Undeniably, the correlation coefficient is slightly above 0.5, indicating that there is a fairly strong positive relationship between MLB payroll amounts and total wins.
. Undeniably, the correlation coefficient is slightly above 0.5, indicating that there is a fairly strong positive relationship between MLB payroll amounts and total wins.

Assuming the MLB payroll amount is $150 million, we can determine the wins total using Equation 1 as shown in Exhibit 1. The predicted value ![]() calculated in Exhibit 1 lies within the range of win totals data points.
calculated in Exhibit 1 lies within the range of win totals data points.

Determination of Correlation Coefficient Using Formula

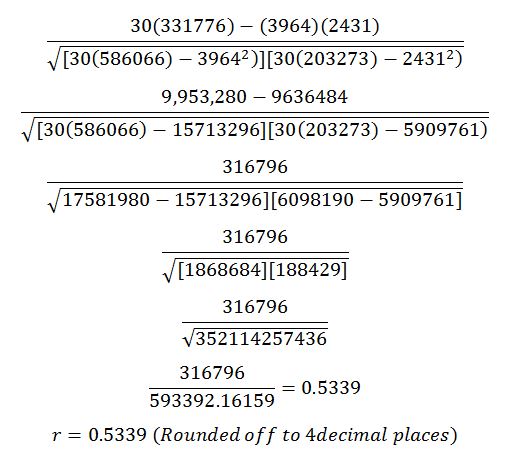
Where x and y represent MLB payroll amounts and wins total, respectively, and n=30. Table 1 shows the values of the items in Equation 2, copied from the Excel spreadsheet.
Table 1: Summary of the Items in Equation 2 from the Excel Spreadsheet.

Determining Outliers Points
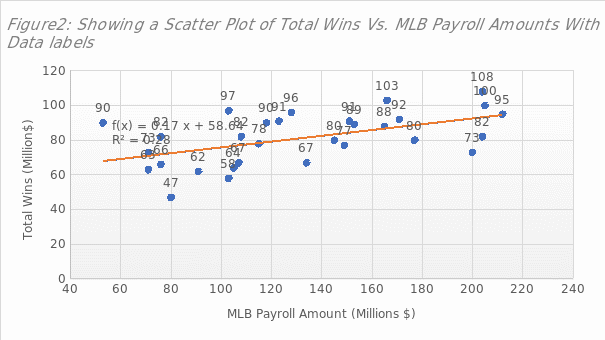
After fitting a linear regression line and activating data labels as shown in Figure 2, outlies points are far away from the line. There are two points identified, including Rays (50,90) and Orioles (80, 47).

Conclusively, linear regression techniques, especially constructing scatter plots and fitting linear regression lines are useful in solving practical problems. The MLB scenario analyzed, yielded a correlation coefficient of 0.5339 (manually calculated) or 0.5338 (Excel generated). This value is slightly more than 0.5, showing a relatively strong positive relationship between MLB payroll amount and win totals.
Reference
Killins, R. (2017). The impact of payroll allocation on winning in Major League Baseball (MLB). Applied Economics Letters, 24(16), 1189-1193. Web.