Introduction
The modern day business environment is characterized by many challenges that require the management to be apt in making decisions that will ensure that the businesses achieve their set goals and objectives (Ambrose & Schminke, 2003, p. 56). The performance of management is measured by its ability to steer the organization to the right direction in line with the set strategy mission and vision.
There are numerous means of measuring the success or failure of organizations. These range from the traditionally known financial measures such as profitability to the modern day combination of both the financial and the non-financial measures (Allen & Gregory, 2011, p. 180). This consultancy report provides an analysis of J Sainsbury Plc.
The Statements Consulted
In this analysis of J Sainsbury Plc, there were two financial statements that were consulted in order to come up with the financial analysis. The income statement is the premier financial statement that indicates whether a company is making profits or not (Madura, 1999, p. 48).
The second financial statement that was consulted is the balance sheet. This is a financial statement that indicates the financial position of a business entity at a given time. The essence of a balance sheet is to point out the sources and uses of funds that have been invested by owners and indicate the health position of the company in terms of cash availability, debt ratios and the returns on the capital employed (Supranyam, & Hasley, 2007, p. 86).
Ratios to Measure the Performance of the Company
There are three main ratios that are used to indicate the financial performance of a company. The ratios are the current ratio, the net profit ratio, and the return on capital employed (ROCE). The importance of the current ratio is that it allows the business to know its ability to meet its current liabilities using the current assets available (Wendy & Mayer, 2003, p. 88).
The non-current assets are the most illiquid assets and in a situation where the business wants to pay off the liabilities owed, it would be almost impossible to the business to convert these fixed assets to cash at their market prices (Vance, 2003, p. 102).
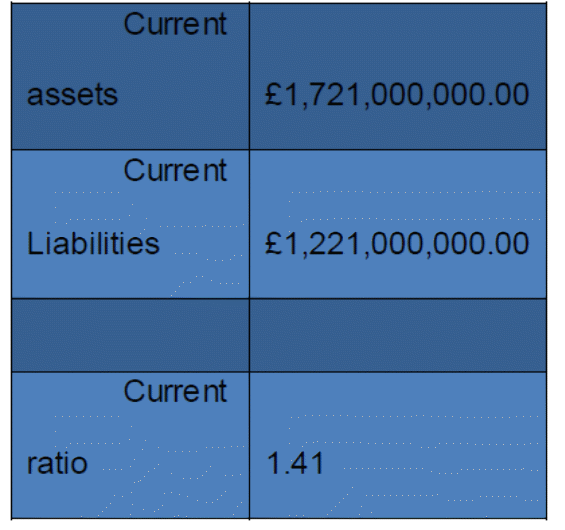
It is therefore admirable that a business maintain current assets that are more than the current liabilities so as to ensure that the business is able to fund the liabilities as they fall due. From the calculation below, the current ratio of J Sainsbury Plc seems okay since the company can pay off its currents liabilities using the current assets and as such, the liquidity position is healthy.
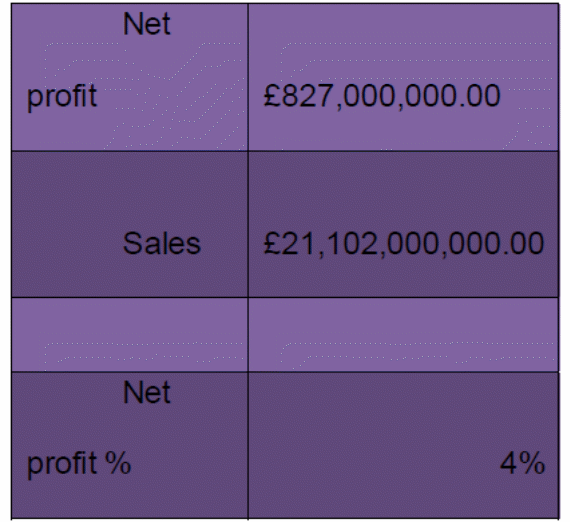
The other financial ratio used is the net profit ratio, which measures the Net profit over sales and shows the percentage of net profit per a unit of sales. For Sainsbury Plc, it is given by the following formula. The net profit percentage of the company is very low. A 4% net profit margin means that there could be other viable options where money can earn better returns than investing in J Sainsbury Plc.
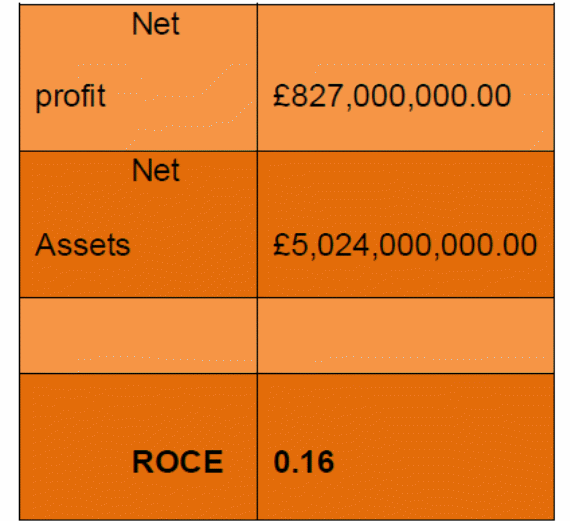
The final financial ratio to be used in the appraisal of the viability of Sainsbury Plc is the return on Capital Employed (ROCE). This shows the amount of benefit the capital contributors gain for the returns by the company and is used to evaluate the appropriateness of investing in that particular company (Baker, 1998, p. 113).
Investors like putting their money of projects or investment options that given a higher rate of return that the market cost of capital or even the interest earned by depositing money in banks savings (Elspeth & Peter, 2002, p. 201). The return on capital employed of 16% is a good indicator that the company is performing well. This is because not many other investment options can guarantee a 16% return on investment and as such, the ‘predator’ company may be interested in taking over the company.
Non Financial Factors
In doing investment appraisal, the financial analysis may not be the only basis for making decisions (Henry, 2007, p. 95). This is because of the fact that the business entities operate in vast environments some which are non-quantifiable.
While a business premier aim is to maximize the shareholders’ wealth and/ or profit maximization, there are other important considerations that the business must put in place before undertaking the various projects that it intends to or making the decisions that spell out the investment path. These factors include:
Training requirements; machine B may be cheaper than machine A yet it requires specialized manpower that may be very expensive to recruit and train. Because of this, an expensive machine can be selected if it has less training requirements.
Availability of spare parts and Servicing costs; some machines are quite expensive to service, in addition, their spare parts may not be readily available and this influences the choice of which machine the organization selects (Pauline & Sidney, 2007, p. 154).
Availability of after sales service; some companies may have favorable terms of sale for their machine. For instance, they can offer after sales services and training to staff on how to use the machine. This influences the choice of the machine to be acquired.
The machines useful life; one machine may provide service to the organization for a long period compared to the other. For example, machine A may be more expensive but it provides 10 years of service. This will definitely influence the choice of the machine to be bought.
Recommendation
From the above analysis, the overall performance of Sainsbury Plc is indicative of healthy operations and the takeover process can commence. The main indicator of this is the return on Capital employed (ROCE) which indicates a 16% return in the year. This is a good performance and with the right strategic measures put in place, the company health performance can be predicted with a high degree of certainty that it will be healthy.
Investment Appraisal
Net Present Value
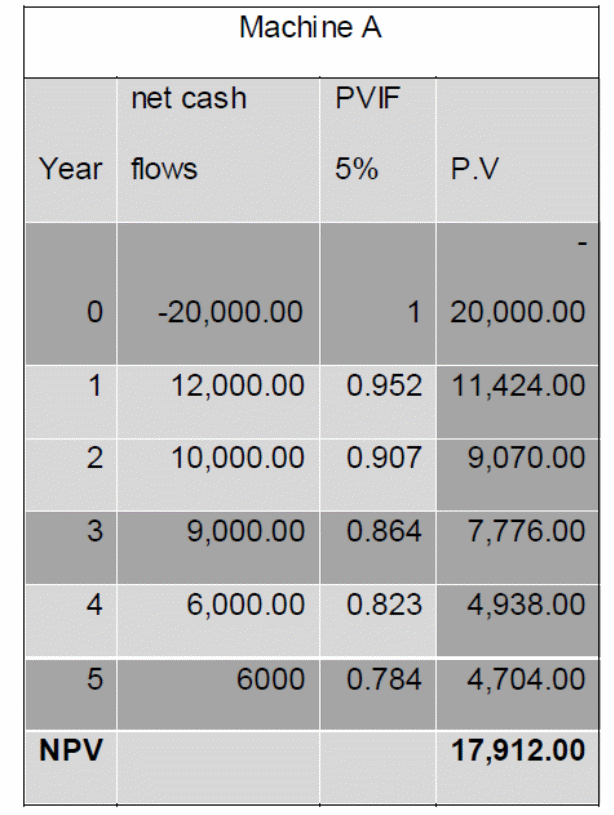
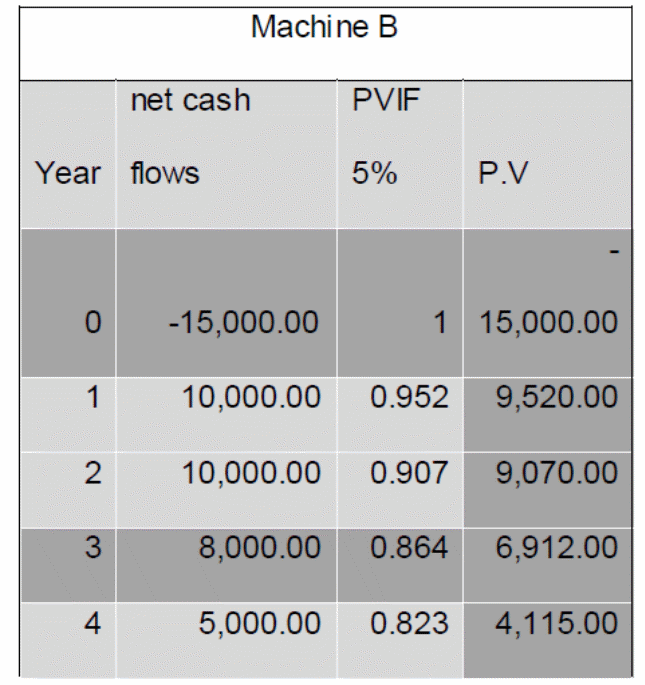

The net present value is a discounted cash flow method appraisal that takes into considerations the present value of the future cash flows to choose an investment decision that is acceptable (Buckley, 2000, p. 206). A project that offers maximum net present value of returns is considered the most preferred and as such, it is chosen as the preferable one. The importance of using the net present value is that it takes into consideration the cost of capital and also the all the cash flows involved (Eitemann & Stonehill, 1998, p. 128).
Using the net present value investment appraisal technique, the best machine to purchase will be machine A since it results in a higher net present value of £ 17,912.00 compare to machine B’s £ 16,185.00.
Payback Method
This is an investment appraisal method that is used to indicate the investment option that will recover the amount of money invested soonest (Shaprio, 2000, p. 188). This is used more so because businesses operate and decisions are made under uncertainty and as such, when finances are invested, the option that pays back earlier is considered less risky and hence preferable.
When appraising a single project, the management sets a predetermined payback period where the project’s viability is determined by its ability to pay back the money invested within the predetermined period otherwise the project is rejected (Shleifer & Vishny, 1992, p. 136).
Using the payback period method the following information is obtained
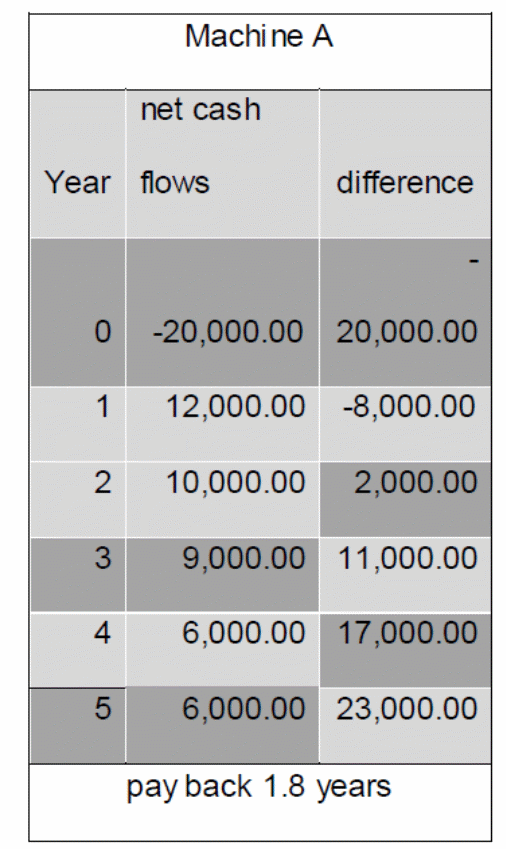
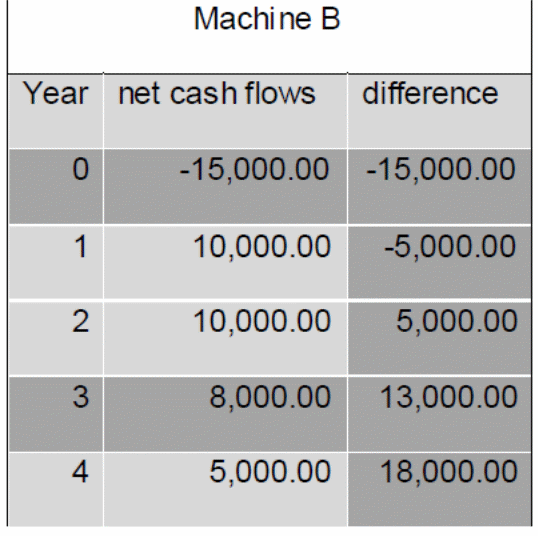

Using the payback period method, the company should purchase machine B since its payback period is shorter than that of machine A.
Average Rate of return
This is an investment appraisal method that looks at the investment cash outlay as a deposit and the net cash flows as an interest thus evaluating the amount the outlay generates (Van-Lelyveld & Knot, 2008, p. 108). To obtain this, the net cash flow is divided by the total investment and the rate is obtained.
Machine A

Machine B

Under the rate of return method project B is preferable since it offers a higher rate of return of 47% compared to the one of 43% on project A.
Implications of the Differences between Machine A and Machine B
The two machines are mutually exclusive meaning if we choose A, we reject B and if we select “B” we reject “A”. The company will have to pay more in the acquisition of machine “A” compared to machine “B”. Machine A costs 20,000 while machine “B” costs 15,000 even though both machines perform the same function.
Even though Machine A is relatively expensive compared to “B”, the cash flows it generates in year 1, year 3, year 4 and year 5 are higher than the cash flows generated by machine B. for year 2, the cash flows from both machines are equal. Machine “A” compensates for its higher price by yielding a higher cash flow to the company.
Similarly, when we take into account the terminal cash flow that both machines will yield at the end of their useful lives, we observe that machine “A” gives a total of 6000 while machine “B” gives only 2000. Similarly, if we take into account the total cash flows generated by each machine over their useful lives, machine “A” generates a total of 43,000 while machine B generates a total of 35,000.
Machine A yields 8,000 more compared to machine “B”. The 8000 is greater than 5000 (20,000-15,000) which is the initial difference in the cost of the two machines.
Investment Recommendation
The NPV suggests that machine “A” is the best, while the payback period and the average rate of return indicates that machine “B” should be purchased. All investments are affected by time yet both the payback period and average rate of return ignore the time value of money.
The payback period ignores the total return from machine “A”, and the timing of return before the payback period. It is true that machine “B” pays back in a shorter time, however, machine “A”, produces slow but significant returns. It should therefore not be rejected on the basis that it delays in producing returns.
Similarly, the average rate of return gives a yearly average. Even though machine “B” has a high average return, machine “A” is much superior because its returns at the later stages are quite high compared to “B”. The method ignores the fluctuations in profits from year to year.
Machine A should be selected based on the NPV results because it recognizes the fact that a dollar today is worth more than a dollar tomorrow, it takes into account absolute changes in cash flows, and can be effectively applied on non conventional cash flows. Machine A should be purchased.
Public Sector Investment Decisions
As opposed to the private sector, Public sector finance management is not a profit oriented undertaking. This therefore differs from the business activities where the investment appraisal is geared towards making profit. In the public sector, finance decisions are made based on the investment option that will result into a better and a more valuable social benefit to the public (Alan, 1963, p. 102).
Cost-Benefit Analysis
Non-Financial Factors
Relief of Congestion
Traffic incidences account many of the much congestion on the road. For each minute that a road is blocked during a peak-hour travel, more than four minutes of travel delay. The traffic system may be economically unviable but its potential in reducing travel delay is a key benefit that can compel the police to invest in the computer aided traffic management system.
Life Saving
Similarly, computer-aided traffic systems increase the efficiency in detecting highway incidents. Such a system can save lives especially for individuals who are seriously injured in an accident. If these systems can help the hospital personnel to arrive at the scene within the shortest time possible, then more lives can be saved. For example in incidences of head trauma, the quick arrival of medical personnel can dramatically increase survival chances.
List of References
Alan, H 1963, Public finance and budgetary policy, Praeger Publishers, New York.
Allen, N & Gregory U 2011, ‘The economics of small business finance: the roles of private equity and debt markets in the financial growth cycle’, Journal of Banking & Finance , vol.7, pp. 236-49.
Ambrose, M & Schminke, M 2003, ‘Organizational structure as a moderator of the relationship between procedural justice, interactional justice, perceived organizational support, and supervisory trust’, Journal of Applied Psychology , vol. 5, no. 3, pp. 60-88.
Baker, J 1998, International finance, Prentice Hall, New York.
Buckley, A 2000, Multinational finance, Prentice Hall, New York.
Eitemann, & Stonehill, A 1998, Multinational business finance, Addison-Wesley, London.
Elspeth, J & Peter, R 2002, Fast forward: organizational change in a 100 days, Oxford University Press, London.
Henry, A 2007, The internal environment of an organization, Oxford University Press, London.
Madura, J 1999, International financial management, International thomson, New Jersey.
Pauline, W & Sidney, J 2007, ‘International financial analysis and comparative corporative performance’, Journal of International Financial Management and Accounting ,vol. 3,no. 10, pp. 111-30.
Shaprio, A 2000, Multinational financial management, Wiley & Sons, New York.
Shleifer, A & Vishny, R 1992, ‘Liquidation values and debt capacity: a market equilibrium approach’, The Journal of Finance ,vol. 6, no. 3, pp. 1343-66.
Supranyam, K & Hasley, R 2007, Financial statement analysis, Mc Graw Hill, New York.
Vance, D 2003, Financial analysis & decision making: tools and techniques to solve management problems and make effective business decisions, McGraw Hill, New York.
Van-Lelyveld, I & Knot, K 2008, ‘Do financial conglomerates create or destroy value? Evidence for the EU’, Journal of Banking and Finance , vol.8, pp. 2312-21.
Wendy, C & Mayer, C 2003, ‘Finance investment and growth’, Journal of Financial Economics , vol. 69, pp. 110-326.