Introduction
Introduction
Like all other academic subjects, mathematics is one that helps the students in better learning and developing their learning skills. Their talent to learn new things and grow with a pace of improvement depends on how much they absorb the essence of studies and skills in their brains.
The subject of mathematics is there since centuries and has helped mankind in not only developing their skills, but also in managing their operations and work accordingly. This research paper focuses on beliefs and attitudes of the mathematics teachers regarding the use of graphics calculators. This chapter highlights the background information regarding the topic of the research along with the central definitions and the research questions.
Background of the Study
Technology has widespread throughout the world with huge reforms, which have improved the living standards of people to great extent (Patterson and Norwood; 2004). Underlying technological advances, the subject of mathematics has gone through many reforms with the passage of time. Humans used beads, stones and fingers for the purpose of counting and doing sums in the Stone Age, which proves that mathematics subject is of pre-historic value (Goos and Bennison, 2007).
As the times changes, the mathematics and counting methods also developed and men made use of several methods by time, which gradually and eventually turned into the use of calculators and computers for their personal ease. Calculators and computers release the human brain as they reduce not only the burden to count things but also has helped in reducing the time to calculate things, as well as providing accurate and fast-produced multiple representations of concepts.
This development gave rise to the invention of the graphics calculators for the ease of students as well as for the teachers. By time, the attitudes and beliefs of teachers and researchers also has changed with the development of mathematics learning and teaching methods, which are use in graphics calculators these days (Geiger et al., 2002; Graham and Thomas, 2000; Kissane, 2000, 2006, 2007; Pierce et al., 2007).
(Stacey, Chick, Kendal; 2004) As the mathematics education is gaining popularity and exploring new horizons, teachers are also exploring for improving student understandings of mathematics. This further promoted the creation of graphics calculators, which made the life of the students and teachers easier and decreased certain difficulties and problems associated with the calculating methods and techniques (Goos, 2003:404; Goos and Bennison, 2007:316).
The formation of graphics calculator is referred to as the advancement in the technology means and integration to that of computers and graphic calculators (Goos, 2003:408). The use of graphics calculators has basically influenced the lives of students. Yet, research is needed about the attitudes and behaviors of teachers in regards to the use of graphics calculators (Goos and Bennison, 2006).
Technology and Mathematics
The means of technology and technology itself has widespread to great extend in relation with the graphics calculators and has helped and contributed in both learning and teaching orders a lot. The significance and importance of technology can be considered with regard to the mathematics education from the following perspectives:
- Societal – The changes in the technology means has changed the lifestyle around in every aspect. Technology has changed the way things are taught to the students in the educational sector as well as in the normal life routine.
- Occupational – The technology advancements has changed the occupational sector with its multi-dimensional attribute and innovations. The occupational changes are observed in the fields of banks, commercial, factories, marketplace and shops.
- Educational – The modernization in the educational field has raised issues in the present age as some of the changes made by the technologies advancements have been welcomes by the teachers and students but some of them are not welcomed at all. This includes graphics calculators as well because some teachers in certain areas with certain beliefs does not like the use of the graphics calculators, as they think it may affect the learning and teaching of mathematics.
- Mathematical – Mathematics field is a very significant and important aspect of education which has been affected by the technology means as it has brought many developments and inventions for the ease of doing mathematical sums and problem solving, but these technologies does not face the overall positive attitude always and also faces some objections form the teaching side by the instructors of mathematics.
Use of Technology and the Changes in Mathematics
The world has seen global changes in the technology sectors in almost every aspect of life. Technology has made the lives of people and individuals easier and hassle-free because it reduces the burden on brains and saves time. The mathematical techniques have been developed to enable the methods of learning mathematics for students and teachers convenient and easier. One of the most used and modernized digital instrument used in this sector is the use of graphics calculators.
The main objective of the graphics calculators is to focus on better “understanding” and “concept development” for the students while saving time of teachers in the mathematics teaching sessions. This method of learning is very convenient and nicely carried out but it also faces different kinds of attitudes and behaviors from the teachers’ side.
Research Questions & Objectives
The research addressed the following questions:
- How do teachers react towards the use of the graphics calculators?
- How do South Australian teachers’ attitudes towards graphics calculators influence their own use of graphics calculators when teaching secondary school mathematics?
- Do the teachers’ beliefs about the teaching and learning of mathematics support or hinder their classroom practice of graphics calculators?
- What factors apart from teachers’ attitudes and beliefs affect the use of graphics calculators by the teachers?
Definitions & Clarifications
Graphics Calculators
A calculator is the simple device which is portable enough to carry in hand and does the simple calculations for individuals. Graphics calculator is the advanced mode of the simple calculator and is capable to carry out tasks of developing graphs, solving equations, and performing several other functions. Graphics calculators were first introduced in the mid-1980s and since then, they have grabbed the attention and popularity from the students sector because it is user-friendly and help students in carrying out several tasks (Burrill, 2005).
Graphics calculators are able to carry out the customized programs because they are programmable; this element is usually used for the science or engineering students. At first, this product was for the professional use, but then the popularity it’s raised and students also started making use of this instrument for their ease of work.
Graphics calculator is the most powerful tool through which the standard and quality of learning could be improved in the classroom for quick and self-learning. These graphics calculators include the following mathematical capabilities: “extensive graphing and numerical equation solving capabilities as well as providing access to matrices, complex numbers, and recursively defined functions, numerical calculus capabilities and elementary statistical hypothesis test” (Kissane, 1999: 209).
Technology
Technology is known to the world in many different aspects and purposes (Floyd, 1997: 7). It is the typical application of science which is used basically for industrial and commercial uses. Technology always begins with a basic need which concludes as a solution for the needy person, company or community. It also involves domains such as; science, design, innovation, need, manufacturing, development, multi-dimension, values and social status. “Technologies range from very powerful computer systems, to much less powerful, but much more pervasive, technologies such as those involving paper and pencil” (Kissane, 2000:1). In this research study, technology is identified as an electronic technology used particularly for graphics calculators.
South Australian Certificate of Education (SACE)
(Department of Education and Children’s Services (DECS), 2006) If defined very shortly, (Keightley, 2002) South Australian Certificate of Education (SACE) is the academic certification which is provided to the students who have successfully and satisfactorily completes their secondary education while living in the state of South Australia (Leithwood and Hallinger, 2002: 580).
Attitude
(Anderson, 2004: 23) Attitude is the complex combination of psychological feelings and behaviors which reflects what you feel, what you do and what you think about an issue. It reflects the nature of the humans and shows their way of reactions towards many situations (Reznichenko, 2007:6).
Belief
(Goos and Bennison, 2007: 320) Belief is the internal psychological state of the human nature, which helps in the proper proposition or premise to be exact. Beliefs are normally are the sense of judgment contained in the human mind (Evans, 2006: 11).
Confidence
(McGinnis, 2005: 97) Confidence is the state of being at the certain point where prediction is regarded is correct or where the chosen set of actions are held effective in certain circumstances. People and individuals may have the state of confidence not only within themselves, but also in other people or forces which are beyond their personal control (Pierce, 2007: 129-136).
Literature Review
Introduction
This chapter provides the literature details associated with the research paper. In short, it focuses on the main themes, such as, review of the graphics calculators’ literature, review of mathematics teachers’ attitudes and beliefs literature, and the review of the use of technology that influences the studies in the mathematical classrooms.
Graphics Calculators and School Mathematics
Graphics calculators are the modern technology which is about the size of the normal scientific calculator and contains a dynamic graphics screen rather than a simple screen with numeric forms as used in the scientific calculators (Simos, 2003: 620). Graphics calculators are used for numerous tasks. They are multi-dimensional and capable of doing lots of tasks simultaneously. The special and unique feature that differentiates graphics calculators from other normal and scientific calculators is that it is programmable; which means it is capable of being customized according to the needs and requirements of the user.
This helps the user in utilizing the graphics calculators for tasks such as; simple and complex calculations, equation solving, graphing functions, tabulating functions, analyzing statistical data, computation, numerical differentiation, plotting graphs, random simulations and doing financial mathematics. Graphics calculators were invented in the mid-1980s and since then they have succeeded in grabbing the attention and interest of teachers and students, especially in the secondary education.
(Simos, 2003: 620) The multi-dimensional graphics calculators have easily completed work for the students and decreased the burden of doing rough work, plotting graphs and calculating manually which consumed extra time. The advantage of graphics calculators is that it is capable to be used according to the will of the user and the user usually takes one or two weeks to get familiarized with the functions and working mode of the graphics calculators.
This is because the graphics calculators has its own personalized software through which it represents functions in tables and graphs form while displaying two-dimensional statistical displays and drawings. In many countries, graphics calculators are being used by many senior secondary students including the post-secondary students. Some universities also allow their students to use the graphics calculators for selective entrance examinations (Li, Wang, Zhang; 2008:37).
Australian schools provide students with technology-enriched classroom environments. Australian schools are also encouraged to use graphics calculators often, because, when used properly, graphics calculators can enhance students’ learning (Australian Association of Mathematics Teachers (AAMT), 2002:2). A diversity of technologies, such as computers, mathematical software, spreadsheets, graphics calculators and CAS (Computer Algebra System) calculators, data logging equipment (e.g. data projector), have been widely used in mathematics classrooms (Goos and Bennison, 2007: 315-324).
Graphics Calculators as “Personal Mathematical Assistant”
(Geiger, 2000: 24) Graphics calculators are similar to the simple scientific and four-function calculators but their way of working and accessibility are much higher than it looks like. They are more than the scientific calculators but a bit less than computers. Because graphics calculators are very ‘intelligent’ and fast devices, they have been one of the favorite technological devices used by the students and teachers in mathematics classrooms (Kissane, 1995: 383-392).
The difference between the graphics calculator and scientific calculator is not simply the screen, rather, it is hidden under the mathematical advancements and technologies installed in the graphics calculators which have given rise to the use of it among students and teachers at the very same time (Burrill, Allison, Breaux, Kastberg, Leatham, and Sanchez, 2003).
The key lies in understanding the potential and accessibility of the graphics calculators in order to know its values and strengths (Goos, Stillman, Vale, 2008: 95). Therefore, the major solution to understand the importance of the graphics calculators lies in understanding its potential through which the accessibility of technology of this device could be increased for the individual students (Kissane, 2000: 60-71). The second aspect lies in the size of the graphics calculators. Graphics calculators are light in weight, battery operated and small in size which makes it more portable and easier to use and carry. The size of the graphics calculators is small enough to carry in hand or inside the school bag (Kissane, 1995: 161-170).
The third aspect is the qualities possessed by the graphics calculators. It is programmable and has built-in software which could be changed and programmed according to the working needs and requirements of the user (Senk and Thompson, 2003: 447).
The Mathematical Potential of Graphics Calculators
(Blum, Galbraith, Booker, Huntley; 1998: 86) Graphics calculators are one of the best renowned devices in the world because it has been welcomed in the educational section whole heartedly as it is capable enough to carry lots and lots of capabilities which satisfies the needs and wants of the students as well as of the teachers in the mathematics sessions. It can be called as a small intelligent computing unit which has many qualities (Kissane, 1995a: 383-392). For example, the research study states that the use of graphics calculators is increased in the schools of South Australia and has been adopted by teachers and students. (Romberg, 1992: 166) Evaluating the typical mathematics units and equations and then representing their concrete conclusion is one quality possessed by the graphics calculators which takes an unsolved equation from the user and then simplifies it by itself and gives the answer to the user (Kissane, 2000: 60-71).
The graphics calculator can also save the data in its storage capacity and then can transfer this information to the computer device of the user. This feature makes it not only portable but reusable as well. However, this is a technological aspect of the graphics calculators.
Apart from that, graphics calculator has also the capability to make a connection between one or more users through communication medium and then it can transfer files from one graphics calculator to another user’s graphics calculator without causing trouble for the user.
(Cooke, 2002: 149) Nonetheless, graphics calculator has the capability to carry out other important and complicated mathematical functions; such as, solving equations, solving systems of equations, factor polynomials, graph functioning, parametric equations, polar equations, sequencing, making stat plots, analyzing statistical data, evaluating derivatives, analyzing integrals, multiplying matrices and drawing graphs.
Advantages of Using Graphics Calculators
(Holton, Artigue; 2001: 23) Mathematics is one subject which needs full concentration and a lot of time to carry out calculations associated with mathematical problems and equations. Graphics calculators save time consumption by carrying out the required calculations quickly, which reduce the burden on teachers and students mind.
(Graham, 2006: 158) The use of graphics calculators facilitates the process of learning for the students because it solves the complex equations and mathematical problems so that, the students focus more on the procedure on how the equation has been solves; rather than concentrating on how to find a solution through which the problem could be solved. (Harskamp, 2000: 37-52) Through this procedure, the graphics calculators may help the students in understanding the mathematics. It may also improve their learning skills and talents which make them enable to carry out solutions from the complicated mathematical problems in future. In short, graphics calculators help the students in improving their mathematical skills.
(Stacey, Chick, Kendal; 2004: 119) Students may also efficiently do different small tasks on it; such as, drawing graphs, analyzing the mathematical results after solving them, saving their work on the device and then sharing it with other users via sharing medium available on the graphics calculators. Ellington (Ellington, 2003) conducted a meta-analysis of findings from 54 research studies published between January 1983 and March 2002. She carried out another meta-analysis of findings from 42 studies on calculator use in middle and high school mathematics courses as well as college courses through first semester calculus (Ellington, 2006).
These two research studies revealed that students improved not only operational skills and problem solving skills (2003), but also procedural, conceptual, and overall achievement skills, when calculators were used in both instruction and testing. Students’ achievement level is also improved when mathematics teachers encourage students to use curricula designed with graphics calculators as a primary tool (Kastberg and Leatham, 2005).
One social benefit of using graphics calculators is that the attitudes of students get better in the mathematics session while studying and they show cooperative behavior towards other students who do not possess graphics calculators.
Drawbacks and Worries Associated with Graphics Calculators
(Forster, Mueller; 2002: 16-36) Graphics calculators are of great importance and also useful for learning and teaching processes, but, there are some drawbacks and worries related to the graphics calculators. These worries are the limitations which cause negative impact of the graphics calculators.
(Somekh, Davis; 1997: 21) One of the negative impacts which the graphics calculators possess is the complex of inferiority which develops among those students who cannot afford the purchasing power of the graphics calculators. This may affect their attitude and grading in the mathematics sessions.
(Taylor, 1995: 68) The skills and talents of the students may get affected through this facility of graphics calculators as the students are not provided with any other facilities in the examination of other subjects, whereas they are allowed to use scientific and even graphics calculators for help. This may affect the attitudes of the teachers of other subjects and mathematics (Hong, 2000: 321-336).
(Kissane, 2006) The excess use of the graphics calculators has proven to affect the critical and conceptual thinking badly and also reduces their troubleshooting and problem solving skills. This is because of the reason that the student no more think out of the box for solving a problem, neither they intend to develop graphics by their own because they rely wholly and solely on the graphics calculators which is very harmful for the mental development of the students on huge scale (Shannon, 1999: 42).
National Survey of Science and Mathematics Education (NSSME)
The National Survey of Science and Mathematics Education (NSSME) has been designed in order to provide and gain up to date and recent information and also to recognize and identify the new trends and advancements in the areas of teaching. These teaching backgrounds would highlight the teachers’ experiences, academics, curriculum, instruction, availability and use of instructional resources used by the teachers around in the schooling systems (Weiss, 2001).
According to the NSSME, approximately 6000 teachers related to the field of mathematics and science from all around the United States schools participated. The NSSME was designed to examine the teachers’ interest, their backgrounds and all the relevant information about them (Weiss, 2001). The high school mathematics classes were divided into three different categories and mathematics courses: formal required, informal review, and formal advanced.
The NSSME outcomes indicated some important differences among the teachers of formal advanced courses and informal review courses (Whittington, 2002). These differences are listed in the following for the ease of the readers and evaluators:
- Eighty-three (83) percent teachers of formal advanced courses replied that they are very comfortable and well prepared in using the calculators in their classrooms to demonstrate mathematics principles, while only fifty eight (58) percent of teachers of informal review responded this way
- Teachers of formal advanced courses (94 percent) were more likely to use calculators than teachers of informal review courses (45 percent)
- Teachers of formal advanced courses were more likely to emphasize learning mathematical concepts, preparing for further study in the subject, and learning how to connect mathematics ideas, compared with teachers of informal review courses
- 61 percent of secondary students used calculators for developing conceptual understanding at least once a week. They were more likely to use calculators to learn or practice skills (81 percent)
All these findings show and indicate that the perceptions of teachers who are preparing their classrooms for the use of calculators would also be affected by the use of calculators. This also points out that teachers’ preparation or confidence in teaching mathematics and of using graphics calculators in their classrooms influences what they want to teach and how they teach their students. Students would also be affected by their teachers or the class in which they were involved (Hong, 2000: 321-336).
Elements Affecting the Technology Use by the Teachers
(Khosrowpour, 2006: 746) Teachers are the main source of the learning procedures in the educational institutions and it depends on every teacher how they teat their students and what procedures do they adopt to teach heir students. So s the case with the mathematics subject in the secondary education system, because this subject gets tougher as compared to other subjects because of its complexity and versatility. The context in which teachers behave and take education of mathematics in their institutions contains two aspects; Personal involvement aspect and the educational institution’s system aspect (Fine and Fleener, 1994; Forgasz and Prince, 2001; Manoucherhri, 1999, Simonsen and Dick, 1997; Walen, Williams and Garner, 2003, cited in Goos, 2003: 404; Goos and Bennison, 2006:3).
(DIANE, 1995: 1256) According to the first aspect, the teachers make use of the technology means to get their personal aspirations and increase their knowledge of education regarding the mathematical subject so that they could use better strategies and formulas or knowledge to make the students understand about the mathematical problem solving (Anderson, 2005: 9-38).
For this purpose, the instructors make use of home computers, computer laboratories, libraries, conversation with highly professional academics, accessibility to different hardware and software, gathering teaching materials from book stores and so many others which include the use of Internet as well. Through this approach, the teachers and professors increase their knowledge, beliefs, professional experience and academic development.
(Urquhart, McIver; 2005: 53) The other factor present here is the management system followed by the educational institution. This setting is set by the institution’s management that the teachers are required to make use of the technology means so that it not only build a nice image of the educational institution but also helps in developing the students interest and learning skills.
Teachers’ Use of Technology
(Goos, Bennison, 2006) Some certain researchers have found that most of the teachers make use of technology for their personal experience and to gather knowledge that what new technology is in the marketplace and has been adopted by the students frequently. In this way, teachers are able to evaluate what kind of technology is under use by their students and how does it helps them in learning the mathematical methods (Kelly, ISTE, NETS; 2002: 197).
The instructors making use of technology usually use the graphics calculators, the Internet, and the computers to help them in the teaching methods of the secondary mathematics education to the students. However, it has not been proved or concluded that by using the modern technologies, the teachers could get inspired by the advanced new technologies and they would recommend their students to use these technologies forever.
(DIANE, 1995: 17) Nonetheless, the use of the technology has to do a lot with the attitudes, behaviors and beliefs of the teachers. The use of technology, such as graphics calculators is, no doubt, good for the learning skills and capabilities but teachers normally think that the students should not become habitual of making use of these technologies since they also have to rely on their mental capabilities and should prove their skills on easy and simple technologies, rather than by using modern and complex accessories. This is because teachers play a very important role in the teaching and learning behaviors, especially for the graphics calculators (Goos, 2003: 404-411).
Beliefs and Attitudes of Teachers towards Graphics Calculators
(Beswick, 2006: 39-68) When the use of the modern technology; such as, graphics calculators is concerned, the beliefs and attitudes of mathematics teachers are totally different from one another. Teachers are an important entity in the field of teaching because they are the communicating, teaching and cooperating source for the learners and students, especially in the field of mathematics (Burton, 1999: 60).
“An emotional element that places nearer the affective than the cognitive… an impact on intention and hence behavior; dependence upon experience and beliefs … confidence or anxiety, liking or disliking mathematics; an inclination to engage in or to avoid mathematics; beliefs about whether one if good or bad at mathematics; and beliefs that mathematics is important or unimportant, useful or useless, easy or difficult and interesting or uninteresting”.
Almost every teacher in the mathematics teaching field appreciated the use of modern technologies, including the use of graphics calculators. But there are certain points on which the teachers react and behave separately. According to a survey, it is the belief of the teachers that the students should use their own strategically thinking while solving any mathematical problem. Although the students could make use of the modern technologies but it should be permitted only to the point when there is no hindrance or difficulty arising for the student to learn the technique to solve that particular problem (Allen, Wilder; 2004: 114).
When the students are not capable to think and are totally dependent on the graphics calculators, then they should not be allowed to use this device as it reduces and minimizes the mental and strategic capabilities of the students which is not a good sign for the future human brain development.
(Bishop, 2004: 449) There are some teachers who use modern technologies and graphics calculators just to know their way of working so that they could guide their students in every possible way. On the other hand, most of the teachers dislike the graphic calculators to the extent when the students lose their mind and are unable to draw graphs, solve equations or think logically for how to come up with a solution for any problem.
Teachers’ Attitudes & Beliefs – Barrier to Change?
At times, the beliefs and attitudes shown by the teachers could be a barrier for adopting the use of graphics calculators in the mathematical lessons. This is because some of the teachers think that if the students make use of technology on large scale, then the teachers might lose their power and control over the students and their classrooms.
Teachers believe that they might lose their power of authority over their students because of the excess use of graphics calculators. This is a psychological factor of human nature, according to which, the humans are afraid of losing their power of sovereignty due to certain reasons. So, in this research study, the teachers may react negatively towards the use of graphics calculators because the use of these technologies may affect the teachers’ authority over their students in the mathematics classrooms.
Another barrier present in this field is the lack of resources available to the teachers. The teachers might be willing to use the graphics calculators and other mode of technologies but they might not have enough time or resources to use and learn them appropriately.
Conceptual Framework
Introduction
In this section, the conceptual framework of the entire research paper is presented. It describes the organized way of thinking about how the project is being taken and how the researcher or writer understands the phenomenon under study. It is the basic conceptual design which explains why students usually work on a particular project and how do they prefer to explain its important aspects to the readers (Mundel, 1967: 3). Emphasize is put on the relationship between the teachers’ beliefs and practices carried out in the mathematics classrooms.
Relationship between Teachers’ Beliefs and Practice
“Teachers treat their beliefs as knowledge”
– (Thompson, 1992:127)
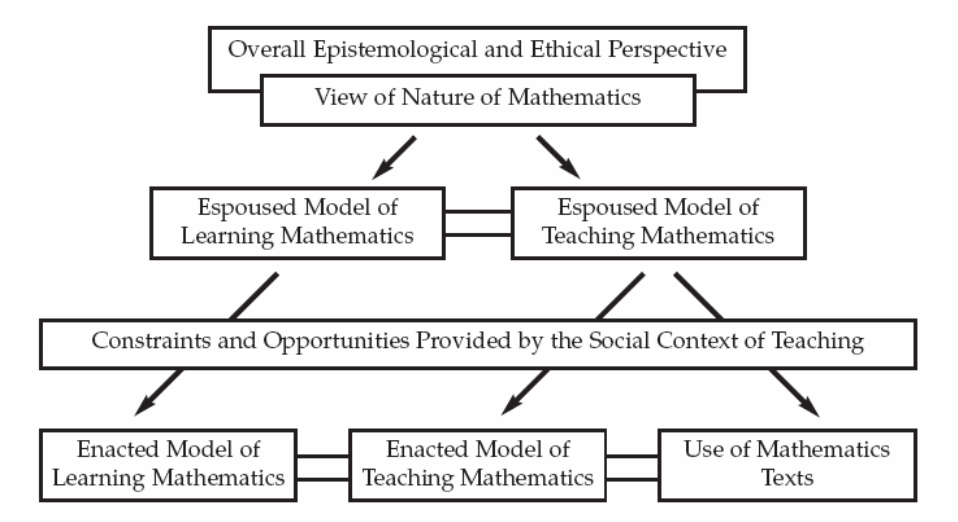
Doing research on the relationship between the beliefs and practice of teachers is very important for mathematics education because it reflects their way of thinking and mental state of thinking and doing things in a particular way. (Ernest, 1991: 3) The supportive and espoused beliefs developed by the mathematics teachers originally come from philosophical and theoretical point of view regarding the environment and behavior of mathematics. He suggested the following model regarding a vital difference between the teachers’ supportive and endorsed beliefs because of the factor of the social background.
The supportive and endorsed beliefs here can also be known as the espoused and enacted beliefs of the teachers. (Ernest, 1991: 290, see figure 3.1) Ernest asserted that the espoused and enacted models regarding the teaching and learning of the mathematics are “mediated by the constraints and opportunities provided by the social context of teaching”. All these relationships are being explained in the following diagram with the help of a descriptive chart which also includes the classroom environment and school management system setting along with the anticipated beliefs of the students, parents and peers (Ernest, 1991: 290).
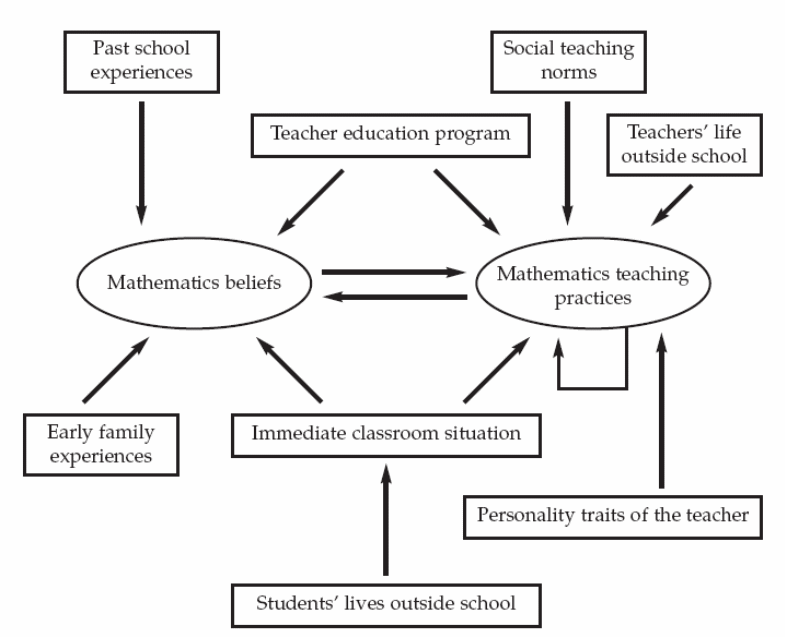
The reasons of the difference present between the teachers’ beliefs and practice along with the level of contradiction has also been highlighted by Raymond (Raymond, 1997: 571, See Figure 3.2). Raymond has also presented the elements and characteristics which are the main reasons behind these differences and contradictions; such as, the lifestyles of teachers and students outside the school, personal experiences, teacher education programs and teachers’ personality traits. Raymond has explained that one of the factors for the difference between the teachers’ beliefs and practice is the social teaching standard and classroom environmental situations affecting the practices of teachers.
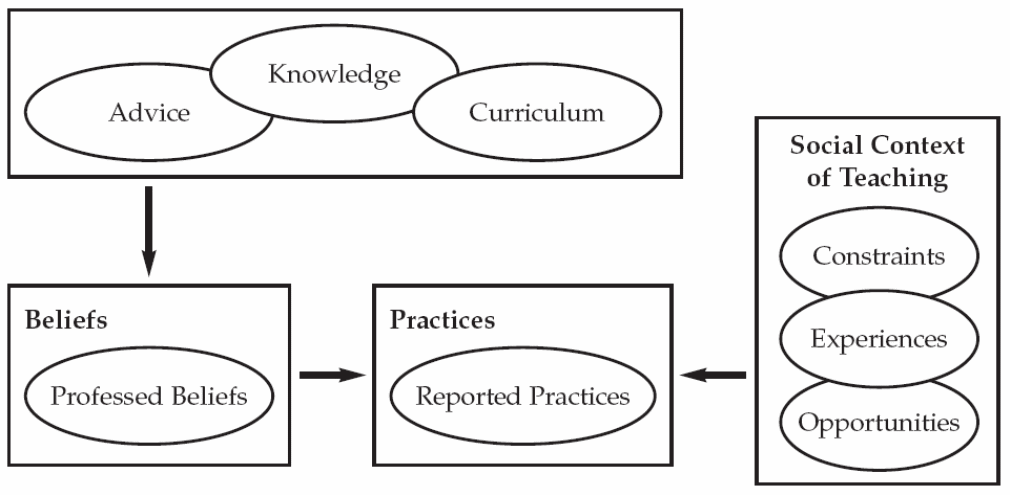
There is another model which reflects the summary form of the elements which affect the teachers’ beliefs and practice in relation with the problem solving of mathematical problems in the primary classrooms (Anderson, 2005: 18). This models uses elements such as, beliefs (what teachers believes), professed beliefs (what teachers acknowledge to believe), practices (what teachers actually do), and reported practices (what teachers have admit to do in their classrooms).
The model would also highlight the elements which affect the teachers’ practice; such as, advice from the professional development education, knowledge about the mathematics subject and curriculum influence on teachers’ beliefs along with professed beliefs. Practices of teachers often get affected by the opportunities, constraints and experiences because of the social context of teaching. However, the following represented model does not display any direct link between the social contexts of teaching with that of beliefs.
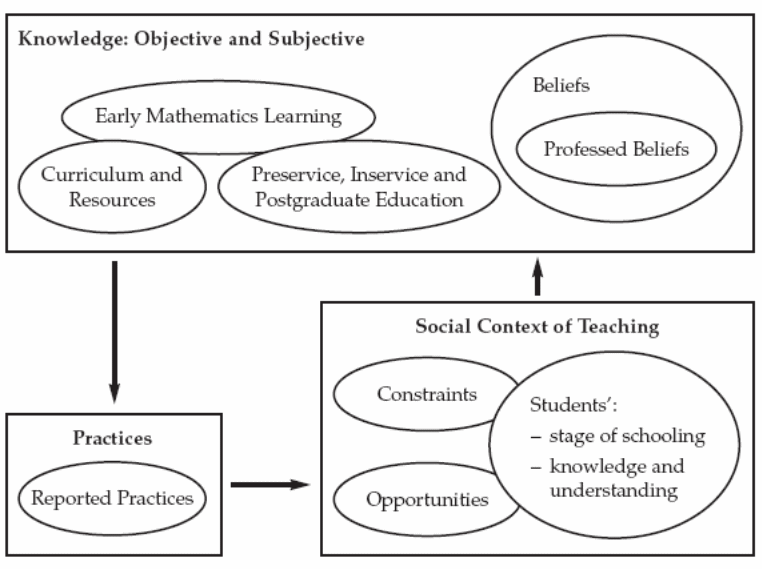
Later on, Anderson revised another model which represents better connection between the factors involved with the teachers’ beliefs and practices. This model can be represented in the following pictorial form for the ease of the readers.
Definition of Beliefs and Attitudes
Beliefs on the dimension of affective-cognitive may be observed in different ways. If the connections between beliefs and knowledge were stressed, the beliefs would represent the cognitive structure of individuals. However, beliefs as a form of reaction, toward a certain situation, means that they are linked to the affective element of individuals (Furinghetti and Pehkonen, 2002: 40).
Therefore, teachers’ beliefs are defined as “teachers’ beliefs about learners, about what counts as good teaching in their institutional culture, and about the role of technology in learning” (Windschitl and Sahl, 2002, in Goos and Bennison, 2007: 315).
Teachers’ beliefs in this study are divided into two: 1) rule-based beliefs and 2) inquiry-based beliefs (Goos, 2003). Goos explains that mathematics teachers who have rule-based beliefs emphasize on procedure, memorization and symbol manipulation, and they are more likely to use calculators as a checking device or graphing tool. Teachers who view mathematics as inquiry-based learning are more likely to utilize calculators as a tool of improving students’ understanding.
Teachers’ attitudes are identified as an emotional reaction to act towards the attitude object. In other words, teachers’ attitudes toward the use of graphics calculators mean positive or negative feelings, such as liking, enjoyment, frustration, and anxiety towards the use of graphics calculators (Gall et al., 2003, in Reznichenko, 2007: 6).
In conclusion, this research examines how teachers’ attitudes and beliefs influence their own use of graphics calculators when teaching secondary school mathematics, along with conceptual framework proposed in Figure 3.2. What factors apart from teachers’ attitudes and beliefs affect the use of graphics calculators also need to be examined?

Research Methodology
Introduction
This chapter explains the research methods used in the research paper, different definitions of research methods, techniques, surveys, and questionnaires used to drive consequential results for the research study. It also highlights the case study of the paper used, which is, the attitudes and beliefs of the teachers about the use of the graphics calculators. It is the unique blend of research element which describes the finding methods used in this research paper. This section also explains what research method has been used in this research paper, how data is collected to collect all these research items, and what instrumental design is used along with the final analysis of the study.
Qualitative Research Methodology
This research study uses the Qualitative research methodology. Qualitative research methods are used in the cases where quality and nonnumeric values are concerned. This research method involves real life experience gathered from a field or a group of people, society, organization, community or even individuals. Qualitative research method is used to seek the originality, real expressions and behaviors of people.
Researchers should look at several considerations in respect to the question ‘how have we come to know what we know?’ and the notion of ‘how to prove what we believe is reality?’ (Glesne, 2006: 6). In line with this perspective, access to reality is carried out through social contexts, such as language, consciousness and shared meanings. Understanding phenomena allows the researcher to employ qualitative research method, which has a main concern of how to develop an in-depth exploration of the central phenomenon (Creswell, 2005: 203).
Qualitative research approach
Qualitative approach allows the researcher to pay attention to participant’s perspectives, ask general and broad questions, collect data from participants, illustrate and analyze meanings from participants, and construct the research (Creswell, 2005: 39). Qualitative research is the best approach to understand a central phenomenon, teachers’ use of graphics calculators in secondary math classrooms, for the scope of this study, as follows:
- Qualitative research is used to obtain in-depth understanding of central phenomenon from participants’ perspectives (Shank, 2006: 134). The researcher has developed phenomena for this study, which is for example; teachers make frequent use of graphics calculators in their classrooms. Understanding of these phenomena helps the researcher to reflect teachers’ responds about their reaction towards the use of graphics calculators in the secondary level school classrooms (White, 1996). Set of phenomena also enables the researcher to draw conclusive results from the research study.
- Qualitative research asks general and broad questions from participants and seeks to understand their experiences. In this study, open-ended questions are asked to obtain participants’ views about the use of graphics calculators. This questioning focuses on understanding of how participants react to the use of graphics calculators. The researcher attempts to allow the participants to express about their experiences.
- Qualitative data consist of general questions to permit the participants to generate responses and collect information from a small number of individuals. These data include participant observation, interviews, documents, and questionnaires and can be selected purposefully or intentionally by the researcher (Fraenkel and Wallen, 2003: 440). Qualitative data can be primarily collected from real life practices or real life events, or documents and recordings of real life (Johnson and Christensen, 2004). In this research study, qualitative data is the small collection of data filled with teachers’ own words to express their opinions.
- Qualitative inquiry makes relatively little use of statistical analysis and refuses to restrict data collection to the use of highly structured, replicable and standardized instruments (Lankshear and Knobel, 2004). Qualitative research is used as a term to embrace various research strategies that share certain characteristics such as phenomenon found in many documents. For this study, the researcher attempts to analyze participants’ thoughts underpinned beyond their own language by interpreting meaning of their responds towards questions, without using statistical tables, graphs, and diagrams.
Main Research Questins
This study aims to explore the following research questions:
- How do teachers react towards the use of graphics calculators?
- How do South Australian teacher’s attitudes towards graphics calculators influence their own use of graphics calculators when teaching secondary school mathematics?
- Do the teachers’ beliefs about the teaching and learning of mathematics support or hinder their classroom practice of graphics calculators?
- What factors apart from the teachers’ attitudes and beliefs affect the use of graphics calculators by the teachers?
Research Method Design
Survey Design
Survey design is the procedure to use for this research study. Survey designs are measures in both quantitative and qualitative research in which a researcher conducts a survey or questionnaire from a small group of people (known as ‘sample’) so as to describe trends in attitudes, opinions, behaviors, or characteristics of a large group of people (known as ‘population’) (Creswell, 2005: 52).
Survey typically examines sample from the population and generalize results from that sample. However, the research focuses on a specific group of people who possess common defining characteristic and seeks to identify their dispositions, not to generalize. Namely, secondary math teachers who make use of graphics calculators as a teaching tool in their classrooms are studied and their attitudes and beliefs toward teaching and learning of mathematics with the technological device are identified in this study.
Many different forms of surveys exist to carry out research, but the researcher has used the method of questionnaire, which helps in collecting data with consistency. The form of questionnaire is used here because it helps in drawing exact and concise results with the same pattern of questions asked from the research participants. There are many advantages of using questionnaire for the research, such as, it is cost-effective, saves time, helps in drawing required results, saves efforts of the researcher and the research participants, and helps the researcher in focusing on the main motive of the research.
The questionnaire surveys are used to help the researcher in identifying the significant beliefs and attitudes of the participants, in this case study, these are attitudes and beliefs of the mathematics teachers about the use of graphics calculators (Grinnell and Unrau, 2005: 150). It helps the researcher in illustrating the exact reactions towards the questions being asked from the participants and also makes the participants realize that the researcher has listened to their opinions very well by giving proper time and attention to the participants’ responses regarding the questions being asked.
Collecting data through questionnaire was chosen for three main reasons: 1) Questionnaire survey is available to everyone easily; 2) It saves time and extra efforts to carry out specific results for the research study; and 3) It is cost effective and helps in drawing exact results from the participants.
The instrument design of this Mathematical Teachers Questionnaire would help in measuring and deriving out the teachers’ beliefs and attitudes towards the use of the graphics calculator along with the facts how it affects their own use of it as a teaching tool in the secondary mathematics classrooms in South Australia. It would also reflect teachers’ opinions about the graphics calculators and how do they think graphics calculators would help the students in their mathematics sessions for learning purpose.
Apart from that, other factors are expressed which would discuss and explore the factors besides teachers’ attitudes and beliefs about the use of graphics calculators. Not only this, but the researched questionnaire would also help in analyzing and understanding the future development of the graphics calculator whether it would be welcome by the students and teachers, or it would always face positive behavior from students but a negative objection oriented behavior from the teachers.
Questionnaire Design
In order to carry out a research instrument design for this study, questionnaires related to the use of technology in math classrooms have been looked into by the researcher. Out of those questionnaires, ‘mathematical beliefs questionnaire’ from Goos (2003), and Goos and Bennison (2004) has been adopted and modified later by the researcher along with the supervision of Professor Tzur, the supervisor of the researcher for carrying out this research study.
A questionnaire was designed based on the following ideas, according to the scope of the conceptual framework identified for this study:
The term of teachers’ attitudes is restricted and used to focusing on the use of graphics calculators in this study. The use of the name of teachers’ beliefs is also limited in the teaching and learning of mathematics.
Teachers’ mathematical beliefs can be divided into two aspects: a) rule-based beliefs and b) inquiry-based beliefs, as mentioned in chapter 3 (Goos, 2003). Statements are paired with respect to these two mathematical beliefs, for example:
26 Doing mathematics involves creativity
27 Doing mathematics involves trial-and-error
Mathematics Teacher Questionnaire was named to clearly show the aim of questionnaire. The questionnaire contains three parts: a) demographic information, b) section A, and c) section B.
Demographic information was designed to allow participants to provide with their basic personal information such as name, school name, gender, year level or class, years of using graphics calculators, years of teaching experience, and math topic participant teaching most frequently. This information examines whether or not there is a relationship between participants’ personal characteristics and their use of graphics calculators.
Section A contains 33 statements. Participants are requested to choose their answers according to the level of agreement with each statement. There are 28 positive statements and 5 negative ones. With the help of Likert scale, the degree of agreement or disagreement could be measured very easily. The positive statements used in the Likert scale exploits following choices: Strongly Agree=5, Agree = 4, Neutral = 3, Disagree = 2, Strongly Disagree = 1, and Not Applicable = 0. On the other hand, the negative statements (Statement 6, 9, 13, 16, 20) used in the Likert scale make use of the choices: Strongly Agree = 1, Agree = 2, Neutral = 3, Disagree = 4, Strongly Disagree =5, Not applicable =0. this methodology helps the researcher in drawing out consistent sequences of results and answers.
This section was designed to reflect how teachers think about teaching and learning of mathematics affect their classroom practice associated with using graphics calculators. Apart from that, other factors would explore the miscellaneous factors besides teachers’ attitudes and beliefs about the use of graphics calculators. The researched questionnaire will also help in analyzing and understanding the future aspect and position of graphics calculator as to whether it would be welcomed by students and teachers together or whether it would always face the welcoming behavior from students but an objection oriented behavior from the teachers.
Section B contains seven (7) open-ended questions. Open-ended questions were designed for participants to provide with opportunity to explain or support their own thoughts shown in Section A. Hence the researcher can achieve not only more deepen understanding about their agreements or disagreements of each statement in section A, but also additional information about their responds through section B. Please refer to Appendix.
Data Collection
According to Axinn and Pearce (2006), data collection is a term which is used to explain the entire procedure of preparing and collecting data for the research study. It describes how information is used while carrying out the research study. For this research study, data collection methods used are the procedures, ethical considerations and participants are explained as follows:
Procedures / Small Sample Size
Procedures are the practical research methods and processes which are used to carry out the research. For this research study, small sampling along with personal meetings and contacts were used with the research participants. To carry out well organized and systematic research for this research study, many principals and heads of secondary mathematics educational institutions in Adelaide were contacted. They were requested to participate in this research survey. Due to some limitations faced by the scope of study, such as, the limitation factor of less time for carrying out the study (the time period of six months), only one secondary school was selected by the researcher.
Apart from that factor, only five teachers out of the many teachers in the secondary school made use of graphics calculators for the purpose of a teaching tool. This is the reason that only those specific five teachers have been used in the research methodology and were requested to complete the survey. The completion of questionnaire was asked to the participants involved in the research after getting the final approval from the University of Adelaide Human Research Ethics Committee and with the final consent and approval of the participants.
Case Study Analysis
Case Study
According to Yin (2003), case study is the collection of data which is related to an individual small group or community and studies them with the help of observations, questionnaires, surveys, meetings and collection of other documentary proofs. Case study is chosen for research papers because it helps in providing real life examples and practices which are carried out by the individuals and companies. Case studies are evaluated on the basis of the chosen research methodologies by the researcher. To achieve successful and perfect research, the data of the case study needs to be collected and analyzed systematically by the researcher. The evaluation process of case studies is normally sensitive needs to be handled carefully. For this research paper, the case study revolves around the beliefs and attitudes of the mathematics teachers regarding the use of the graphics calculators in Adelaide, South Australia.
This case study is based on the examination and questionnaire survey of five individual mathematics teachers who make use of graphics calculators in their secondary classrooms on a daily basis. This research has been studied those five teachers so that the reader can easily analyze the understanding and thinking of the mathematics teachers and their response to the use of graphics calculators in the secondary classrooms as a learning and teaching tool simultaneously.
Participants
The participants involved in this research study are five in number. All these individuals are the secondary school teachers in Adelaide, South Australia who make use of graphics calculators in their classrooms and find them very helpful for the purpose of teaching and learning simultaneously. These teachers were contacted through the management of the school and were not provided with any incentives for helping in carrying out the research. They have helped the researcher on volunteer basis.
Ethical Considerations
(Rossi, Lipsey, Freeman; 2004: 259) While carrying out any kind of educational research study, particular ethics should be considered very carefully in that the personal interests, opinions and well-beings of the participants and people are not harmed and affected. This is because significant ethical issues could take place while carrying out research for the study and while carrying out data collection, especially in the case where family members and community members are involved in surveying, researching or questioning at sites outside the questioning room or place. At times, data collection is occupying, stressing, time consuming and invading which may affect the feelings of the research participants that they are being stressed, pressurized, invaded against and have given less time to complete the surveys or answer all the questions properly (Lankshear and Knobel, 2004: 101, 184).
In order to carry out successive research for this study, approval from University’s Human Resource Ethics Committee was provided after a lot of consideration and evaluation (Project No: H-042-2008) (See Appendix 1).
Because of the privacy and personal opinions of the teachers’ being surveyed, their information and responses will remain confidential under the policy used for carrying out this research. The data used in this research will remain confidential with the written approval of the teachers and the department of school (See Appendix ). For the sake of keeping the research participants’ identity and privacy confidential, their responses will be used anonymously. It should be made clear that the participation by the research participants is entirely on a volunteer basis and they were provided with no incentives in order to help the research for this study.
Apart from that, there is no risk for anybody involved personally in this study because this study will remain safe in the custody and data collection of the school property and will be demolished after the maximum time period of five years.
However, the implications and results of this research study are expected to be very helpful for the in-service and pre-service teachers which would help them to analyze how the use of graphics calculators will be helpful for using it as a teaching tool in their secondary classrooms.
Reliability and Validity of the Methodology
Reliability and validity is the quality measurement of the research study. Both are necessary to judge the height and standard of the work. Reliability reflects the consistency of data searched; while validity proofs accuracy of the research study work and affects the influence of quality put in the project. Together, both of them help the research results to correspond with reality with affirmation and verification.
The whole study carried out in this research paper is said to Normal Reliable, and Normal Validated.
Limitations Faced
While compiling this research paper, several limitations have been faced which are related either to the corporate reasons or the academic reasons of the researcher. These limitations are listed as under:
- The research carried out for this dissertation by the student (researcher) could be biased because of the qualitative data representative on the web as well as the information gathered by the interviewees
- The information present are several and different every time it has been carried out, hence the information displayed is limited because there are numerous and uncountable sources present, but all of them cannot be presented in this detailed research paper
- The information presented by the research participants may vary because they are conducted from different people who might have different views and opinions; and their opinions may vary from one another
- The research carried out is not extensively complete
- The research is carried out by a student, hence, the information may face conflicts by its lecturer or this assignment could be different from the point of view of the lecturer
Result & Findings
Introduction
This chapter represents the final result and findings achieved from the research methodology section of this research paper. The results are presented with what have been achieved with the help of the research participants. The final findings in hands for this study are related to the mathematics teachers’ beliefs and attitudes towards the use of the graphics calculators achieved by questioning and personal meetings with several teachers. All these findings are provided and described in the following sections for the knowledge of the readers.
Mathematics Teacher Survey – Research Carried out
Participants
The participants involved in this research study are five in number. All these individuals are the secondary school teachers who make use of graphics calculators in their classrooms and find them very helpful for the purpose of teaching and learning simultaneously. Their demographic information can be viewed in the following tabular form as:
Section “A” Questions
Section “B” Open-Ended Questions
The short open-ended questions asked by the participants for completing Section B were plotted according to the following order:
Thank you for your cooperation.
Result & Findings – Mathematics Teachers’ Beliefs and Attitudes towards the Use of Graphics Calculators
According to the research participants, the subject of mathematics is very interesting and attracts a lot of people. Especially for the individuals who have become instructors and teachers of this particular subject. All mathematics teachers have stated that they like to teach mathematics very much (A1) because it gives extra mind power and strength, and helps them in remaining up to date with the modern techniques of mathematics. It also helps them to teach these techniques to other students and subordinates who contact them either through personal relations or through the school system. Every teacher has strongly agreed to this point that they personally like to teach mathematics and for that, they can also go for an extra mile when there is a need.
The use of technology has attracted everyone, including the mathematics teachers as well because it is human nature that humans gets attracted to those things which are introduced new in the marketplace and succeeds in grabbing attention of various people. Almost every mathematics teacher feels very comfortable to use the graphics calculators (A2) because they are not only advanced in technologies but also has improved and helped teachers and students (A7, 8, 12, 14, 15, 22).
By saying that almost every teacher makes use of the graphics calculators (B1) doesn’t mean that they think that using graphics calculators is interesting to use for every purpose (B2, 3). Many of teachers like to use graphics calculators in their classrooms (B5), but there is a certain ratio of teachers who think that the use of graphics calculators is not interesting perpetually (A3). Sometimes, the students need to use their own intelligence and problem solving skills to solve particular mathematics problems.
If there is a ratio of teachers who doesn’t support the use of graphics calculators always, then it also doesn’t means that they are not confident to use graphics calculators while teaching in their secondary mathematics classroom sessions (A4, B4). Most of the teachers are not hesitant to introduce new technologies in their classrooms but there are certain situations and limitations which are needed to be implemented for the use of new technologies (A5).
When asked about opinion of teachers regarding the use of graphics calculators that whether it could deteriorate down the basic mathematical skills of the students, then most of the teachers replied negatively (A6). Because using graphics calculators also needs intelligence and basic mathematical skills which are required for operating this device. So there is no issue of getting mathematics skills affected by using the graphics calculators in the classrooms. In fact, teachers believe that the use of these devices may help the students in understanding their complicated mathematical problems and typical concepts (A7).
Another group of teachers agreed to this statement that the use of graphics calculators can be linked among different representations to help out the students in understanding the basic concepts of mathematics (A8). These different representations can termed as algebra, numeric or graphs.
Graphics calculators are user-friendly and their operations and functions are easier to learn. Therefore, almost every teacher declined this fact that understanding the operations of graphics calculator may be difficult and time-consuming for the students (A9). In fact, graphics calculators are very helpful in supporting the applications of real-life applications because of it is simple nature and low profile (A10).
Graphics calculators are a modern device which has been updated since the time of its development. Most of the teachers believe that they make modern technologies and modern learning methods accessible to the students (A11). However, a small ratio of teachers disagrees to this statement. Teachers also believe that with the help of the graphics calculators, students may easily explore unfamiliar mathematical problems, since this device is familiar with almost all the mathematical problems techniques (A12). Therefore, there is no problem associated with it.
Some of the teachers also believe that they might need graphics calculators to teach their students. However, another class of the teachers disagrees with this statement and they claim that they can easily teach their students without the help of graphics calculators (A13). Another clash between the thoughts of the mathematics teachers is that some of them think that graphics calculators have the capability to carry out calculations and graph plotting quickly, which would improve the performance of the students (A14). However, the other class of teachers disagrees with this statement and has their own certain opinions about it.
Some teachers also believe on this point that the use of graphics calculators is to particularly make calculations and plot graphs may improve their way of teacher, whereas other class of the teachers also disagrees with this theory completely (A15).
There is a mutual compliment for the use of graphics calculators that it does not wastes the time of students while studying in classes (A16). It helps the students in exploring complicated mathematical methods and ideas (A17). In fact, most of the teachers want to polish and improve their capabilities to use graphics calculators in their mathematical classroom sessions (A18). A very selected number of teachers agree to this point whereas others disagrees that having graphics calculators do routine work and practice makes them more likely to try different instructional methods (A19).
Most of the mathematics teachers prefer the use of graphics calculators in plotting graphs while mathematical sessions, whereas a selective number of teachers like to plot graph by using their own set of skills and knowledge (A20). Not only this, but the use of graphics calculators has the capacity and capability to provide fast, rapid and dynamic feedback of students’ work which assists them in accordance while teaching (A21).
It has been observed by some of the teachers that the use of graphics calculators has helped in improving the overall behavior of a certain class of students towards mathematics, while there is another class of students whose behaviors have not been changed by using this technology (A22). With the help of graphics calculators, many mathematical problems can be solved by different solving methods (A25). There is no specific certain method which deviates the students from studying (A24). Apart from that, the use of graphics calculators helps students in developing the element of creativity (A26).
Almost every mathematical teacher disagrees to the point that doing mathematics involves the factor of trial-and-error (A27). Same goes with the opinion of solving a mathematical problem which requires the need for finding a rule or formula which could be applied (A28). It is because the main role and aim of all the mathematics teachers is to provide the students with activities which could encourage them in exploring mathematical ideas and concepts (A29). It is because of the fact that good teaching requires discussions in the classrooms (A30) where students could their ideas and concepts with the teachers and develop mutual understanding. That is why, most of the teachers believe that the use of physical objects for introducing mathematical ideas in as essential component of learning mathematics (A32).
Apart from that, there is a conflict between some teachers who at times agrees or disagrees with the opinion that good mathematical lessons progresses step-by-step in a planned sequence towards the lessons objectives (A31) and working out numerous routine problems helps students in the learning of mathematical concepts (A33).
It has been proved from the research study that teachers utilize graphics calculators frequently in their classroom sessions. They make use of these modern devices to help themselves and the students for the topics of algebra, calculus, statistics, graphing functions, matrices, polynomials, business applications and even geometry at times.
The activities for which graphics calculators are being used by the teachers are; graphing-finding maxima/minima, graphing derivative, calculations, finding area under curve, exploring models, graphing, algebra, finance, trial and error, solving quadratic and cubic equations, statistical-binomial, and in many iterative processes.
It is observed that many teachers’ confidence has been affected by using the graphics calculators, which does not affect other teachers at all. Many teachers like to use graphics calculators because it is multi-dimensional, easy to use, helps students in many ways, helps teachers to understand the underlying processes and it is easy to see the trends and patterns here as compared to other applications.
The use of graphics calculators does not affect dispositions in classrooms of many teachers. However, some of the teachers and their sessions may get affected but it does not happen all the time. In fact, many teachers believe that graphics calculators can help the students in exploring new innovative ways to solve mathematical problems, develops better understanding of the concepts, and is good for modeling purpose.
According to the research carried out, every teacher likes to use graphics calculators while teaching in their secondary mathematics classrooms regularly. As per the Case 1, she likes using graphics calculators because she thinks; “It (graphics calculator) allows the students to gain a better grasp of the concept and can help students go into things further. It also helps the slow ‘algebra’ student to still have success”. The male teacher in Case3 likes to use graphics calculators daily; “I am intrigued by what it (graphics calculator) can do, and so I am interested to see how it changes the teaching of mathematics”.
As observed from both the examples, math teachers are inspired by the benefits of graphics calculators as a teaching tool. In other words, teachers make use of graphics calculators, not merely because of graphics calculators’ particular capability, such as doing calculations and plotting graphs easily, but because of graphics calculators’ positive aspects on students’ learning of mathematics.
Math teachers like exploring mathematical ideas with the help of graphics calculators and they feel confident while teaching in their mathematics classroom sessions. For example, Case 1 points out that teachers’ confidence is related to the use of graphics calculators; “The more confident you are with them (graphics calculators), the more you will use them. The more success you have with them, the more you will experiment with them and this will help the students learn more effectively”. Case also states that graphics calculators encourages mathematics teaching because; “The more confident you are, the better you will teach the topic. Because you can give visual representations of concepts and further develop concepts”.
The teachers strongly appreciate the use of graphics calculators in the mathematics class sessions for unfamiliar mathematics problem solving or mathematical ideas exploring purpose. It is also clear that teachers’ positive attitudes about graphics calculators have positive influence on their beliefs. However, it is not obvious that using graphics calculators may result in improving teachers’ dispositions towards the use of graphics calculators.
Every math teacher makes use of graphics calculators in the classroom with their espoused beliefs about the teaching and learning of mathematics. to support this statement, Goos (Goos, 2003) indicates that teachers with rule-based views about mathematics are more inclined towards the use of graphics calculators as a checking or graphing tool, and other teachers who evaluate the subject of mathematics as inquiry-based, are inclined towards the use of graphics calculators as a helping device for students’ conceptual understanding development.
This perspective has been derived from the research participants, that is, Case 1 and Case 3.
Case 1 has relatively non-rule-based beliefs, for example, she strongly agrees with statements that reflect the creativity of mathematical activities, and teacher’s role as a facilitator to encourage students’ exploration of mathematical problem solving ideas.
Case 1 makes use of graphics calculator with student-centered beliefs as well as inquiry-based views about mathematics. She strongly agrees with the statement “graphics calculators’ particular capacity to make calculations and graphing quicker and easier improves not only student math performance, but also teacher’s teaching of math”.
Discussion & Conclusion
Introduction
This chapter explains the final discussion and conclusion, and also analysis the details that are presented in the previous chapter and would give a final conclusion for the convenience of the reader.
Overall Research
This research is inspired by the following ideas:
- Graphics calculators have a number of advantages utilized by the teachers and students for learning and teaching of secondary school mathematics;
- Students are influenced by the teachers’ dispositions about mathematics teaching and learning by using graphics calculators.
The purpose of this research study is to examine the teachers’ attitudes towards graphics calculators which influence their own use of graphics calculators when teaching secondary school mathematics in Adelaide, South Australia. It also analyzes teachers’ beliefs about the teaching and learning of mathematics, which support or hinder their classroom practice of graphics calculators. The other factors apart from teachers’ attitudes and beliefs which affect the use of graphics calculators are explored as well.
For this study, a survey design has been adapted from the Goos and Bennison (Goos and Bennison, 2004: 78) by the researcher and completed by the mathematics teachers. One secondary school was selected by the researcher due to some limitations faced by the scope of the study such as, the limitation factor of less time for carrying out the research. Five mathematics teachers were requested to participate in this study and completed the questionnaire survey, because those specific teachers used graphics calculators as a teaching tool in their secondary school mathematics classroom sessions.
The case study for this research revolves around the teachers’ beliefs and attitudes regarding the use of the graphics calculators in Adelaide, SA. The information provided by the survey questionnaire has come from the Likert scale thirty-three statements and seven open-ended short questions. Final analysis of the data collected has been examined very carefully by the researcher according to the research methodology as mentioned previously. The use of qualitative method in this study derived the conclusion of the study by understanding the opinions of the research participants involved in the research.
Discussion –From the Research Carried Out
The conclusive discussion derived from the results of the analysis of data collected in this study and would be presented following the order of the research questions.
Question 1 – How do teacher’s attitudes towards graphics calculators influence their own use of graphics calculators when teaching secondary school mathematics in Adelaide?
Every teacher strongly agrees that they like using graphics calculators and feel confident teaching math with graphics calculators. These teachers strongly appreciate the use of graphics calculators in the mathematics class sessions for certain and special complex mathematics problem solving purposes. If teachers like graphics calculators and then they make use of them, for instance, and those who use graphics calculators often build confidence as well. In addition, every math teachers respond affirmatively that they use graphics calculators in their every day life routine while teaching and they also encourage their students to make use of graphics calculators to some extends. In spite of their daily use of graphics calculators, the mathematics teachers do not actually make use of graphics calculators in their classrooms for every purpose.
Therefore, it is clear that math teachers’ attitudes toward using graphics calculators affect their use of them as mentioned before. In addition, math teachers are likely to be inspired by the benefits of graphics calculators, when using graphics calculators as a teaching tool. Namely, teachers seem likely to make use of graphics calculators, not merely because of graphics calculators’ particular capacity to make calculations and graphing quicker and easier, but because of graphics calculators’ positive aspects on students’ learning of mathematics.
It is also clear that teachers’ positive attitudes about graphics calculators are likely to have positive influence on their beliefs, graphics calculators help students understand mathematical concepts.
However it is not obvious that the use of graphics calculators improve teachers’ dispositions towards the use of graphics calculators.
Question 2 – Do the teachers’ beliefs about the teaching and learning of mathematics support or hinder their classroom practice of graphics calculators?
Graphics calculators have the potential to solve out many complex and complicated mathematics problems. This has increased the ratio of use of graphics calculators in everyday mathematics classes for the purpose of teaching and studying. The research participants of this research study make use of graphics calculators daily as a teaching tool in their classroom sessions. Their beliefs and attitudes are pretty affirmative and positive towards the use of graphics calculators since this device helps the user and saves a lot of time consumption in the normal problem solving procedure. However, the beliefs and attitudes of teachers towards the use of graphics calculators in their mathematics class room sessions for the purpose of studying are not so encouraging for the students.
Almost every teacher agrees to the fact that there is no doubt in understanding the importance of graphics calculators, but they are not useful for the purpose of continuous studying by the students. This is because of the fact that frequent use of graphics calculators may affect the technical problem solving skills of the students and can also affect their natural capabilities of learning as well. in general, the teachers support the use of graphics calculators but when it comes to daily routine and frequent use, teachers stress on using students own problem solving skills mostly for building up strong thinking, supporting and problem solving skills.
Question 3 –Are there any other factors apart from the teachers’ attitudes and beliefs, which affect the use of graphics calculators?
Almost every mathematics teacher encouraged the use of modern technologies, including the use of graphics calculators. But there are certain things for which the teachers react and behave separately. There are quite many factors which may affect the use of graphics calculators besides their beliefs and attitudes. One of the negative impacts which the graphics calculators possess is the complex of inferiority which develops among those students who cannot afford the purchasing power of the graphics calculators.
This may affect their way of attitude and also their grading in the mathematics sessions. The skills and talents of the students may get affected through this facility of graphics calculators as the students are not provided with any other facilities in the examination of other subjects, whereas they are allowed to use scientific and even graphics calculators for help. The excess use of the graphics calculators has proven to affect the critical and conceptual thinking badly and also reduces their troubleshooting and problem solving skills. The context in which teachers behave and take education of mathematics in their institutions contains two aspects; Personal involvement aspect and the educational institution’s system aspect.
Teachers normally think that the students should not become habitual of making use of these technologies since they also have to rely on their mental capabilities and should prove their skills on easy and simple technologies, rather than by using modern and complex accessories. Although they could make use of the modern technologies but it should be permitted only to the point when there is no hindrance or difficulty arising for the student to learn the tactic to solve that particular problem. Math teachers’ demographic information may affect their use of graphics calculators. Many think that if the students make use of technology on large scale, then the teachers might lose their power and control over the students and their classrooms.
The technology of graphics calculators has faced both kinds of attitudes from the teachers’ side. Some of them strongly agree to make use of graphics calculators, while others strongly disagree with it. Graphics calculators are a tool. Real understanding does not happen because of a graphics calculator. You learn math by doing and thinking being creative. Graphics calculators like rulers make thing easier, but rarely make teaching better. That is the teacher’s job!
Conclusion
The subject of mathematics contains innovation and creativity within its core and dimension. It helps the students and teachers in understanding the problem solving skills and techniques. This subject is not quite new, in fact it has been observed that man has made use of mathematics since centuries and has developed his skills accordingly with the passage of time.
Developing the problem skills means that there can be helping tools, techniques and devices which could be used by the teachers and students for mathematical problem solving along with the factor of saving time. This can be achieved by the use of graphics calculators.
Graphics calculators were developed in the mid-1980s and since then it has been in use by the mathematics teachers and students and has supportive feedback from both sides. The invention of graphics calculators helped the use of technology and changes occurred in the mathematics curriculum. Graphics calculators is an unique and dynamic calculating device which is portable enough to be carried by the user easily and does the calculations and multi-dimensional mathematical problem solving for the user. Graphics calculators are programmable and can be customized according to the needs and requirements of the user. Graphics calculators are means of modern technology used mostly by the commercial and industrial sector, along with the educational sector for multi-tasking purposes.
Graphics calculators are just like ordinary calculators, but it is capable of doing several mathematical oriented operations. Apart from the simple calculations, it is capable to carry out other tasks like plotting graphs, equation solving, graphing functions, tabulating functions, evaluating of statistical data, computation, financial mathematics, random simulations and numerical differentiations.
They are more than the scientific calculators but a bit less than computers because graphics calculator are very intelligent and fast devices which have been one of the favorite devices used by the students and teachers in the mathematics classrooms. The difference between the graphics calculator and scientific calculator are the mathematical advancements and technologies installed in the graphics calculators which has given rise to the use of it among students and teachers at the very same time.
The different aspects which make graphics calculators unique and diversified from other devices are; 1) portable size, 2) cost-effectiveness, and 3) the dynamic capabilities possessed by this modern mathematical device. Evaluating the typical mathematics units and equations and then representing their concrete conclusion is one quality possessed by the graphics calculators which takes an unsolved equation from the user and then simplifies it by itself and gives the answer to the user. It has the quality to save data in its storage capacity which can later be transferred to the main computer. Apart from that, graphics calculators have the feature of connectivity. One or more users can connect themselves by using graphics calculators and share their data files with each other whenever they want.
There are many advantages associated with the graphics calculators; these advantages and benefits are utilized by the mathematics instructors and students simultaneously for learning and teaching. It saves time and facilitates the process of learning for the students because it solves the complex equations and mathematical problems for them, and eventually help the students in developing their learning skills, strategically make different small mathematical assignments and helps in developing the attitudes and behaviors of the students in the classrooms. Graphics calculators have faced both kinds of attitudes from the teachers’ side. Some of them strongly agree to make use of graphics calculators while others strongly disagree with it.
(Kissane, 2006) The excess use of the graphics calculators has proven to affect the critical and conceptual thinking badly and also reduces their troubleshooting and problem solving skills. This is because of the reason that the student no more think out of the box for solving a problem, neither they intend to develop graphics by their own because they rely wholly and solely on the graphics calculators which is very harmful for the mental development of the students on huge scale (Shannon, 1999: 42).
References
Patterson, Nikita D; Norwood, Karen S.; 2004, A Case Study of Teacher Beliefs on Students’ Beliefs about Multiple Representations, Journal International Journal of Science and Mathematics Education, Publisher Springer Netherlands, Issue Volume 2, Number 1 / p5-23.
Floyd, Chris; 1997, Managing Technology for Corporate Success, Published by Gower Publishing, Ltd., p7.
Leithwood, Kenneth A; Hallinger, P.; 2002, Second International Handbook of Educational Leadership and Administration, Published by Springer, p580.
Anderson, Mac; 2004, The Power of Attitude, Published by Thomas Nelson Inc, p23.
Evans,G R; 2006, Belief: A Short History for Today, Published by I.B.Tauris, p11.
McGinnis, Alan Loy; 2005, Confidence: How to Succeed at Being Yourself, Published by Augsburg Fortress, p97.
Stacey, Kaye; Chick, Helen; Kendal, Margaret; 2004, The Future of the Teaching and Learning of Algebra: The 12th ICMI Study, Published by Springer, p119.
Educational Resources Information Center (ERIC, U.S.), National Institute of Education (NIE, U.S.); 1977, Resources in Education, Published by Dept. of Health, Education, and Welfare, National Institute of Education, p17.
Simos, T. E. ; 2003, Computational Methods in Sciences and Engineering 2003: Proceedings of the International Conference (Iccmse 2003), Published by World Scientific, p620.
Li, Shangzhi; Wang, Dongming; Zhang, Jing-Zhong; 2008, Symbolic Computation and Education, Published by World Scientific, p37.
Kissane, B. ; 1995, The Importance Of Being Accessible: The Graphics Calculator In Mathematics Education, In Fong, H.K. (Ed.) Proceedings of the First Asian Technology Conference on Mathematics, Singapore, Association of Mathematics Educators: Singapore, 161-170.
Geiger, V.; 2000, Background and issues for the implementation of widespread access to graphics calculator technology, Published dates 30-31 March 2000, Publisher Australian Association of Mathematics Teachers, Adelaide, p24.
Senk, Sharon L. ; Thompson, Denisse R.; 2003, Standards-Based School Mathematics Curricula: What Are They? What Do Students Learn?, Published by Lawrence Erlbaum Associates, p447.
Goos, Merrilyn; Stillman, Gloria; Vale, Colleen; 2008, Teaching Secondary School Mathematics: Research and Practice for the 21st Century, Published by Allen & Unwin, p95.
Blum, W. ; Galbraith, P.; Booker,G.; Huntley, I. D.; 1998, Mathematical Modelling: Teaching and Assessment in a Technology-rich World, Published by Horwood, p86.
Holton, Derek Allan; Michèle Artigue; 2001, The Teaching and Learning of Mathematics at University Level: An ICMI Study, Published by Springer, p23.
Graham, Alan; 2006, Developing Thinking in Statistics, Published by Paul Chapman Publishing, p158.
Stacey, Kaye; Chick, Helen; Kendal,Margaret; 2004, The Future of the Teaching and Learning of Algebra: The 12th ICMI Study, Published by Springer, p119.
Romberg, Thomas A.; 1992, Mathematics Assessment and Evaluation: Imperatives for Mathematics Educators, Published by SUNY Press, p166.
Cooke, Heathe; 2002, Success with Mathematics, Published by Routledge, p149.
Somekh, Bridge; Davis. Niki; 1997, Using Information Technology Effectively in Teaching and Learning: Studies in Pre-service and In-service Teacher Education, Published by Routledge, p21.
Taylor, Martin; 1995, The Mathematical Gazette, Published by: The Mathematical Association, Vol. 79, No. 484, p68.
Shannon, Kathleen M; 1999, Who’s the Winner? An Exercise in Measurement, Teaching Statistics, Salisbury State University, Vol. 21, p42.
Khosrowpour, Mehdi; 2006, Emerging Trends And Challenges in Information Technology Management: 2006 Information Resources Management Association International Conference, Washington, DC, USA, May 21-24, 2006, Published by Idea Group Inc (IGI), p746.
1995, Teachers & technology: making the connection, Published by DIANE Publishing, p1256.
Urquhart, Vicki; McIver, Monette; 2005, Teaching Writing in the Content Areas, Published by ASCD, p53.
Kelly, M. G. Peggy; International Society for Technology in Education (ISTE), NETS Project Staff; 2002, National Educational Technology Standards for Teachers: Preparing Teachers to Use Technology, Published by ISTE (Interntl Soc Tech Educ, p197.
1995, Power on ! new tools for teaching and learning, Published by DIANE Publishing, p17.
Burton, Leone; 1999, Learning Mathematics: From Hierarchies to Networks, Published by Routledge, p60.
Allen, Barbara; Wilder, Sue Johnston; 2004, Mathematics Education: Exploring the Culture of Learning, Published by RoutledgeFalmer, p114.
Bishop, Alan J.; 2004, International Handbook of Mathematics Education, Published by Springer, p449.
Mundel, Marvin Everett; 1967, A Conceptual Framework for the Management Sciences, Published by McGraw-Hill, Digitized 2006; p3.
Thompson, A.G.; 1992, Teachers’ beliefs and conceptions: a synthesis of the research, Handbook of Research on Mathematics Teaching and Learning, New York: Macmillan, p127.
Ernest, P; 1991, The Philosophy of Mathematics Education, London: The Falmer Press.
Katz, Mitchell H.; 2006, Study Design and Statistical Analysis: A Practical Guide for Clinicians, Published by Cambridge University Press, p3.
Maxwell, Joseph Alex; 2005, Qualitative Research Design: An Interactive Approach, Published by Sage Publications, p146.
Axinn, William G.; Pearce, Lisa Deanne; 2006, Mixed Method Data Collection Strategies: Strategies, Published by Cambridge University Press, p123.
Rossi, Peter Henry; Lipsey, Mark W.; Freeman, Howard E.; 2004, Evaluation: A Systematic Approach, Published by Sage, p259.
Silverman, David; 2004, Qualitative Research: Theory, Method and Practice, Published by SAGE Publications Ltd, p201.
Brace, Ian; 2008, Questionnaire Design: How to Plan, Structure and Write Survey Material for Effective Market Research, Published by Kogan Page Publishers, p178.
Grinnell, Richard M.; Unrau, Yvonne A.; 2005, Social Work Research and Evaluation: Quantitative and Qualitative Approaches, Published by Oxford University Press, p150.
Yin, Robert K.; 2003, Applications of Case Study Research, Published by Sage Publications, p47.
A national statement on mathematics for Australian Schools, 1990, the Curriculum Corporation for the Australian Education Council.
Anderson, J., White, P., and Sullivan P., 2005, Using a Schematic Model to Represent Influence on, and Relationships Between, Teachers’ Problem-Solving Beliefs and Practices, Mathematics Education Research Journal, Vol. 17, No. 2, 9-38.
Ang, K. C., and Lee, P. Y., 2007, The Influence of Technology on the Teaching and Learning of Mathematics in Singapore, Electronic Journal of Mathematics and Technology, 79-84. Web.
Arnold, S., 2004, Mathematics Education for the Third Millennium: Visions of a future for handheld classroom technology, In Putt, I., Faragher, R., and McLean, M (Eds.), Mathematics Education for the Third Millennium: Towards 2010, MERGA, 1-13.
Australian Association of Mathematics Teachers (AAMT), Graphics Calculators and School Mathematics: A communiqué to the education community. Web.
Barkatsas, A., 2005, A New Scale for Monitoring Students’ Attitudes to Learning Mathematics with Technology (MTAS), In Clarkson, P., Downton, A., Gronn, D., Home, M., McDonough, A., Pierce, R., and Roche, A. (Eds.), Building Connections: Research, Theory and Pratice, Proceedings of the 28th Annual Conference of the Mathematics Education Research Group of Australasia (MERGA), 129-136.
Barkatsas, A., and Malone, J., 2003, Secondary Mathematics Teachers’ Beliefs About Assessment and Factors That Influence These Beliefs, In Bragg, L., Campbell, C., Hetbert, G., and Mousley, J. (Eds.), Mathematics Education Research: Innovation, Networking, Opportunity, Proceedings of the 26th Annual Conference of the Mathematics Education Research Group of Australasia (MERGA), 104-111.
Barkatsas, A., and Malone, J., 2005, A Typology of Mathematics Teachers’ Beliefs about Teaching and Learning Mathematics and Instructional Practices, Mathematics Education Research Journal, Vol. 17, No. 2, 69-90.
Beswick, K., 2005, The Beliefs/Practice Connection in Broadly Defined Contexts, Mathematics Education Research Journal, Vol. 17, No. 2, 39-68.
Beswick, K., Watson, J., and Brown, N., 2006, Teachers’ Confidence and Beliefs and their Students’ Attitudes to Mathematics, MERGA, 68-75.
Blackwell Science Ltd., 1999, Journal of Clinical Nursing, 8, 762-763.
Burrill, G., Allison, J., Breaux, G., Kastberg, S., Leatham, K., and Sanchez, W., 2003, Handheld Graphing Technology in Secondary Mathematics: Research Findings and Implications for Classroom Practice, Michigan State University.
Creswell, J. W., 2005, Educational Research, Planning, Conducting, and Evaluating Quantitative and Qualitative Research, Pearson, Merill/Prentice Hall, New Jersey.
Mathematics-a Curriculum Profile for Australian Schools, 1994, Curriculum Corporation, Australian Bureau of Statistic. Web.
Department of Education and Children’s Services (DECS), 2006, Success for All: SACE Review at a glance. Overview of the SACE Review, Report to the Minister for Education and Children’s Services on the Review of the South Australian Certificate of Education, The State of South Australia, Adelaide.
Dubinsky, E., 1999, book review: What is Mathematics Really? (From Hersh, R., 1998, London: Vintage), Notice of the AMS, Vol. 46, No. 9. Web.
Fennema, E., and Sherman, J.A., 1976, Fennema-Sherman Mathematics Attitudes Scales: Instruments Designed to Measure Attitudes toward the Learning of Mathematics by Females and Males, Journal for Research in Mathematics Education, Vol. 7, No. 5, 324-326
Fogarty, G., Cretchley, P., Harman, C., Ellerton, N., and Konki, N., 2001, Validation of a Questionnaire to Measure Mathematics Confidence, Computer Confidence, and Attitudes towards the Use of Technology for Learning Mathematics, Mathematics Education Research Journal, Vol.13, No. 2, 154-160.
Forster, P., A., and Mueller, U., 2002, Assessment in Calculus in the Presence of Graphics Calculators, Mathematics Education Research Journal, Vol.14, No. 1, 16-36.
Geiger, V., Galbraith, P., Goos, M., and Renshaw, P., 2002, Matching the Hatch-Students’ Choices and Preferences in Relation to Handheld Technologies and Learning Mathematics, In Barton, B., Irwin, K. C., Pfannkuch, M., and Thomas, M.O.J.(Eds.), Mathematics Education in the South Pacific, Proceedings of the 25th Annual Conference of the Mathematics Education Research Group of Australasia (MERGA), 293-300.
Goos, M., 2003, Learning to Teach Mathematics with Technology: A Case Study of Beliefs-in-context, In Bragg, L., Campbell, C., Hetbert, G., and Mousley, J. (Ed.), Mathematics Education Research: Innovation, Networking, Opportunity, Proceedings of the 26th Annual Conference of the Mathematics Education Research Group of Australasia (MERGA), 404-411.
Goos, M., and Bennison, A., 2006, Technology Use in Secondary Mathematics Classrooms: A Survey of Queensland Teachers, The Annual Conference of the Australian Association for Research in Education.
Goos, M., and Bennison, A., 2007, Technology-Enriched Teaching of Secondary Mathematics: Factors Influencing Innovative Practice, In Watson, J. and Beswick, K. (Ed), Mathematics: Essential Research, Essential Practice, Proceedings of the 30th Annual Conference of the Mathematics Education Research Group of Australasia (MERGA), 315-324.
Goos, M., Galbraith, P., Renshaw, P., and Geiger, V., 2000, Reshaping Teacher and Student Roles in Technology-Enriched Classrooms, Mathematics Education Research Journal, Vol. 12, No.3, 303-320.
Goos, M., Galbraith, P., Renshaw, P., and Geiger, V., 2003, Perspectives on Technology Mediated Learning in Secondary School Mathematics Classrooms, Journal of Mathematical Behavior, Vol. 22, No. 1, 73-89.
Graham, A., and Thomas, M.O.J., 2000, Building a Versatile Understanding of Algebraic Variables with a Graphic Calculator, Educational Studies in Mathematics, Vol. 41, No. 3, 265-282.
Harskamp, E., Suhre, C., and van Streun, A., 2000, The Graphics Calculator and Students’ Solution Strategies, Mathematics Education Research Journal, Vol. 12, No.3, 37-52.
Hong, Y., Y., Thomas, M., and Kiernan, C., 2000, Supercalculators and University Entrance Calculus Examinations, Mathematics Education Research Journal, Vol. 12, No. 3, 321-336.
Iben, M., F., 1991, Attitudes and Mathematics, Comparative Education, Vol. 27, No. 2, 135-151.
Johnson, B. and Christensen, L., 2004, Educational Research Quantitative, Qualitative, and Mixed Approaches, Pearson Education, Inc.
Jones, K., 2005, Graphing Calculators in the Teaching and Learning of Mathematics: a research bibliography, MicroMath, Vol. 21, No. 2, 31-33.
Kastberg, S., and Leatham, K., 2005, Research On Graphing Calculators at the Secondary Level: Implications for Mathematics Teacher Education, Contemporary Issues in Technology and Teacher Education, Vol.5, Iss. 1. Web.
Keightley, J., V., 2002, School Based Assessment in South Australia, Paper Presented to Hong Kong Examinations and Assessment Authority Seminar Latest Development in Educational Assessment, Senior Secondary Assessment Board of South Australia (SSABSA).
Kissane, B., 1995a, Technology in Secondary School Mathematics-the Graphics Calculator as Personal Mathematical Assistant, In Hunting, et al.(eds.), Regional Collaboration in Mathematics Education, Proceedings of the 1995 conference of the International Commission on Mathematical Instruction(ICMI), 383-392.
Kissane, B., 1995b, The Importance Of Being Accessible: The Graphics Calculator In Mathematics Education, In Fong, H.K. (Ed.), Proceedings of the First Asian Technology Conference on Mathematics, Association of Mathematics Educators: Singapore, 161-170.
Kissane, B., 1999, Technology for the 21st Century: The Case of the Graphics Calculator, the Proceedings of the International Conference on Mathematics Education into the 21st Century: Societal Challenges, Issues, and Approaches, Casio, Cairo, 208-217.
Kissane, B., 2000, Technology and the Curriculum: The Case of the Graphics Calculator, In M.O.J. Thomas (Ed), Proceedings of TIME 2000: An International Conference on Technology in Mathematics Education, Auckland, 60-71.
Kissane, B., 2006, Technology in Secondary Mathematics Education: The Role of Calculators, Proceedings of the Second Thailand World Teachers’ Day Congress, Bangkok. Web.
Kissane, B., 2007, Teaching and Learning Elementary Calculus Concepts with a Graphics Calculator, In Lim, C.S., Fatimah S., Munirah G., Hajar, S., Mohd. Hashimah, Y., Gan, W.L., and Hwa, T. Y.(Eds), Proceedings of Fourth East Asia Regional Conference on Mathematics Education, University Sains Malaysia, Penang, 243-250.
Lankshear, C., and Knobel, M., 2004, A Handbook for Teacher Research: from design to implementation, Open University Press.
Mesa, V., 2008, Solving Problems on Functions: Role of the Graphing Calculator, PNA, Vol. 2, No. 3, 109-135.
Mitchelmore, M., and Cavanagh, M., 2000, Students’ Difficulties in Operating a Graphics Calculator, Mathematics Education Research Journal, Vol. 12, No.3, 254-268.
National Council of Teachers of Mathematics, 1989, Curriculum and Evaluation Standards, Reston, VA: NCTM.
National Council of Teachers of Mathematics, 2000, Principles and Standards for School Mathematics, Reston, VA: NCTM.
Nyaumwe, L., and Buzuzi, G., 2007, Teachers’ Attitudes towards Proof of Mathematical Results in the Secondary School Curriculum: The Case of Zimbabwe, Mathematics Education Research Journal, Vol. 19, No.3, 21-32.
Pierce, R., Stacey, K., and Barkatsas, A., 2007, A Scale for Monitoring Students’ Attitudes to Learning Mathematics with Technology, Computers and Education, Vol. 48, Iss. 2, 285-300.
Pomerantz, H., 1997, The Role of Calculators in Math Education, Prepared for the Urban Systemic Initiative/Comprehensive Partnership for Mathematics and Science Achievement (USI/CPMSA) Superintendents Forum Dallas, 1-20.
Reznichenko, N., 2007, Design and Study of the Instrument to Assess Students’ Attitude toward Graphing Calculator. Web.
Senior Secondary Assessment Board of South Australia (SSABSA). Web.
South Australian Curriculum, Standards and Accountability Framework (SACSA), 2001. Web.
Texas Instruments, 2003, Using Handheld Graphing Technology in Secondary Mathematics: What Scientifically Based Research Has to Say, Texas Instruments by Interactive Educational Systems Design (IESD), Inc.
Walsh, M., 2003, Teaching Qualitative Analysis Using QSR NVivo, The Qualitative Report, Vol. 8, No. 2, 251-256, Keene State College.
Weiss, I.R., Banilower, E.R., McMahon, K.C., and Smith, P.S., 2001, Report of the 2000 National Survey of Science and Mathematics Education, Chapel Hill, NC: Horizon Research, Inc.
Whitenack, J. W., Knipping, N., Novinger, S., Coutts, L., and Reys, B., 1998, Using Technology to Foster Teachers’ Reflections about Children’s Arithmetical Thinking, Teaching Children Mathematics, 484-488. Web.
Whittington, D., 2002, Status of High School Mathematics Teaching, from Report of the 2000 National Survey of Science and Mathematics Education, Chapel Hill, NC: Horizon Research, Inc.
Wiersma, W., 1995, Research Methods in Education: An Introduction, Allyn and Bacon, Massachusetts.