Introduction
Mathematics is a field of study which has been very useful in various sorts of analysis leading to business decision making. In this paper, the focus is on applying mathematical tools and techniques to business decision-making. The paper starts with a discussion of PERT and CPM Techniques. Then the use of this technique in project planning is elaborated. Finally, both thee techniques are combined as an application and a business decision is made. Relevant examples are discussed to illustrate the link of PERT/CPM to business decision-making. Graphical modeling of a sample project is done.
Critical Path Method (CPM)
This method is used to identify the shortest path available. In business, various processes are identified for doing a particular job and the shortest way to finish the job is identified using CPM.
Critical Path Method (CPM) charts are similar to PERT charts and are sometimes known as PERT/CPM. In a CPM chart, the critical path is indicated. A critical path has a set of dependent tasks (each dependent on the preceding one) which together take the longest time to complete. Although it is not normally done, a CPM chart can define multiple, equally critical paths. Tasks that fall on the critical path should be noted in some way, so that they may be given special attention. One way is to draw critical path tasks with a double line instead of a single line.
Tasks that fall on the critical path should receive special attention from both the project manager and the personnel assigned to them. The critical path for any given method may shift as the project progresses; this can happen when tasks are completed either behind or ahead of schedule, causing other tasks which may still be on schedule to fall on the new critical path.
Project Evaluation and Review Technique (PERT)
Program evaluation and review technique (PERT) charts depict task, duration, and dependency information. Each chart starts with an initiation node from which the first task, or tasks, originates. If multiple tasks begin at the same time, they are all started from the node or branch, or fork out from the starting point. Each task is represented by a line which states its name or another identifier, its duration, the number of people assigned to it, and in some cases the initials of the personnel assigned. The other end of the task line is terminated by another node which identifies the start of another task, or the beginning of any slack time, that is, waiting time between tasks.
Each task is connected to its successor tasks in this manner forming a network of nodes and connecting lines. The chart is complete when all final tasks come together at the completion node. When slack time exists between the end of one task and the start of another, the usual method is to draw a broken or dotted line between the end of the first task and the start of the next dependent task.
A PERT chart may have multiple parallel or interconnecting networks of tasks. If the scheduled project has milestones, checkpoints, or review points (all of which are highly recommended in any project schedule), the PERT chart will note that all tasks up to that point terminate at the review node. It should be noted at this point that the project review, approvals, user reviews, and so forth all take time. This time should never be underestimated when drawing up the project plan. It is not unusual for a review to take 1 or 2 weeks. Obtaining management and user approvals may take even longer
Project Planning and Management: CPM/PERT
Consider the planning stage of a large-scale project (for example, the construction of Disneyland in HK). Successful completion of the project requires completion of hundreds of different activities by several different groups or companies (e.g. MTR builds the rail links, HK Government builds roads, KMB builds bus routes, SHK builds hotels, a roller-coaster company from Japan builds one ride in the park, McDonald’s builds some restaurants, etc.) Ideally, we want to complete the project as soon as possible.
This could be done if each activity was completed in parallel. However, it is often impossible to begin some activities before some other activity has been completed. For example, construction of buildings cannot begin until the forest cover over the Penny Bay area (site of Disneyland) has been cleared. Thus the entire project is broken into a set of well-defined activities. Further, the time taken to complete each activity is to be estimated.
The questions that the CPM/PERT analysis can answer include the following.
- What is the earliest time to complete the entire project?
- Given an activity, what is the earliest time to do it?
- Which activities are the bottlenecks? These are activities that, if their completion is delayed, the entire project will be delayed.
- What is the latest time that to begin an activity, and still not delay the project?
For example, it will take six months to hire and train a set of people to wear stuffed animal costumes and dance on the street; Disneyland will open in December 2008. So hiring and training need not begin until the summer of 2005.
Graphical Modeling of Project Activities
In classical modeling of CPM/PERT as graphs, it is convenient to represent each activity as an edge. The weight of the edge indicates the time required to complete it. Each node represents a milestone, which is the point in time when a particular activity is completed and/or some activity is begun. The edges are directed, and the head of the edge is incident on the node representing the milestone corresponding to the completion of the activity.
The requirement that some activity cannot begin before another activity has been completed imposes a precedence relationship. Therefore, the arrows in our graph will depict the sequence in which the activities can be completed (equally: the paths indicate the sequence in which milestones can be achieved).
The graph also models the precedence relations of the milestones. If activity u must be completed before starting activity v, we indicate this by an arrow from the milestone (complete u) to the milestone (begin v). However, there may be no real activity between these two events – in which case this edge will have a weight = 0; such edges are called dummy edges since they only represent precedence, but not a real activity.
To successfully model a project in terms of a PERT network, we must first list out all precedence relationships. It is sufficient, for each activity, to identify its immediate predecessors.
Example
Consider a project to construct a small Hydroelectric Power Plant. The details of the different activities, their precedence constraints, and the estimated times are shown in the table below.
Once the project plan data is in a form such as above, it can be expressed in the form of a directed graph using the following method.
- Construct a node, s, representing the start of the project.
- For each activity that has no immediate predecessor, make an edge incident from s.
- Other activities are added to extend the graph according to the list of immediate predecessors; when there are two activities such that some of their immediate predecessors are the same, but some are not, we need to introduce a dummy activity to represent the precedence constraint.
- In the end, all activities that have no successor are connected to a common node that represents the finish of the project.
Construct the graph for our hydroelectric plant project. In the graph, denote the edges by the activity names, in lower case letters. Each node represents the end of the activity or activities that are depicted by the edges incident to it; likewise, it depicts the point in time to begin any activity whose corresponding edge is incident from this node. The weight of the edge is the duration of the activity it represents. The dashed lines are the dummy edges: these edges are not given any name and have weight=0. They are used to depict the precedence constraints.
Figure 33a shows the first few steps in constructing the PERT graph. We begin with node s, and add the edge a, for activity a, which will take 6.2 weeks. Since activity a is an immediate predecessor for both b and c, so the edges for these two activities are incident from the node depicting the end of activity a, namely node A.
Figure 33b shows the situation where a dummy node is required. Activity c is an immediate predecessor of activity c. However, both activities b and d are immediate predecessors of task e. Therefore we need a dummy edge connecting the events depicted by nodes B and D. Since task e can only begin when all activities depicted by the edges incident to its starting node (namely node D in the figure), this dummy edge ensures that task b is also completed before task e begins.
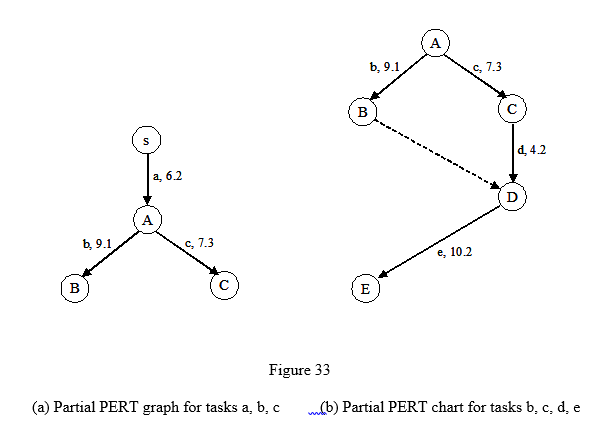
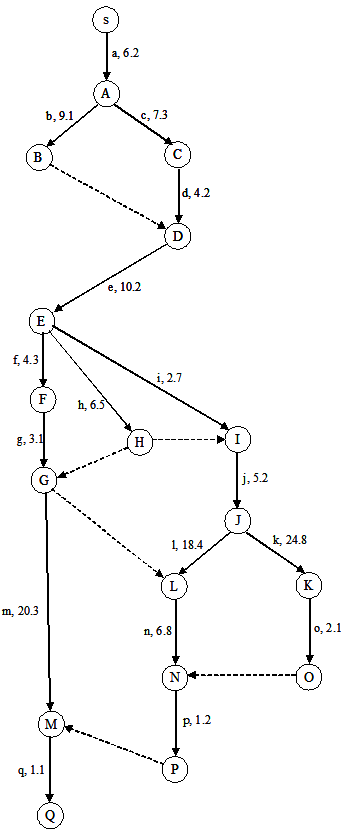
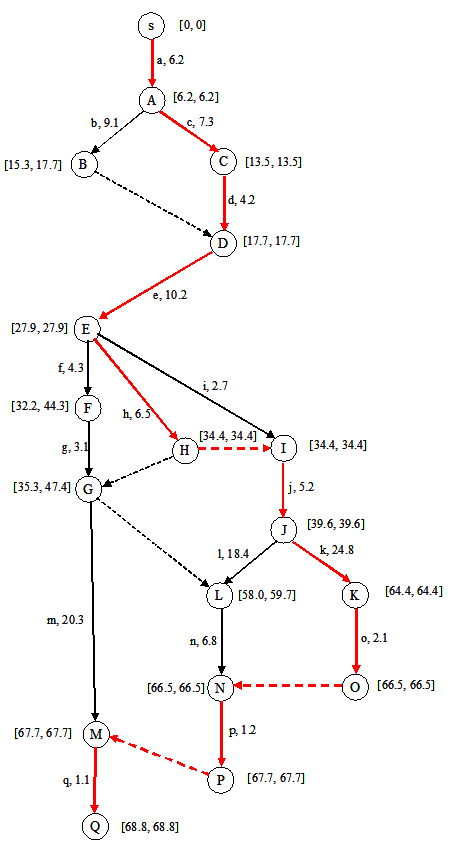
Figure 34. The entire graph is for the example.Once the PERT graph is completely constructed, we process it in two stages. In the first stage, called the Forward pass, the earliest possible start time for each activity is estimated. In the second stage, called the Backward pass, the latest allowed start time for each activity is estimated.
Forward pass
Begin from the start node, and compute the earliest time that each successive activity can begin. Earliest start time at node s = 0. Any edge (activity) that is incident from this node can be traversed in time equal to its weight. This gives the completion time of the activity. The maximum completion time due to each edge incident on a node is the earliest start time of any activity that begins from this node. This is the necessary and sufficient condition for all precedence constraints to be satisfied.
Thus in the graph, the earliest end time of activity a = 6.2; this is written in square brackets next to the node for “end of activity a”, namely node A.
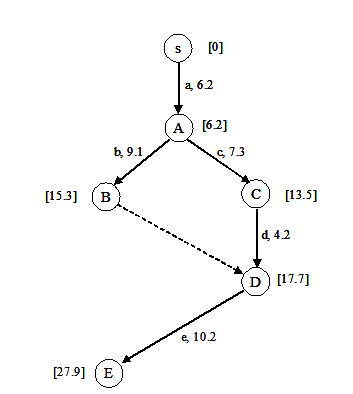
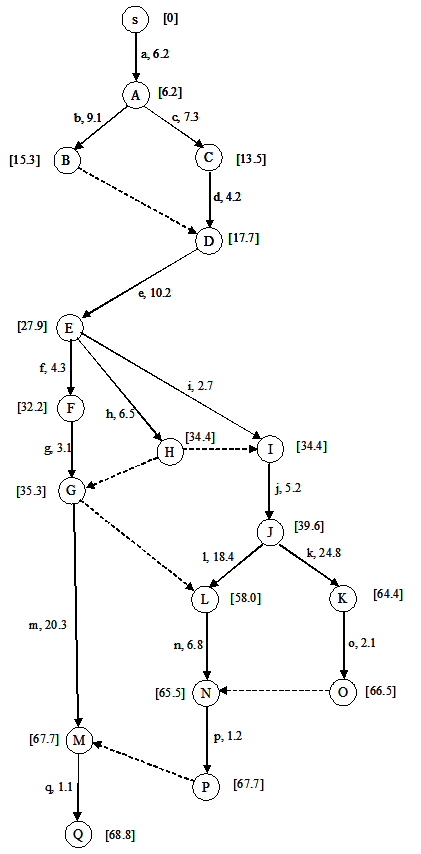
Notice that activity e has two immediate predecessors: b (which cannot be completed before 15.3), and d (which cannot be completed before 17.7). Thus, task e, which begins from node D, cannot begin before the maximum of these two, namely 17.7; therefore e cannot end before 17.7 + 10.2 = 27.9. Following this logic, the forward pass is completed as shown in Figure 36. From the graph, it is clear that the earliest time when we can complete the project is 68.8.
Backward pass
For the backward pass, begin at the finish node (in our case, node Q). The objective is to answer the following question: given the earliest completion time for the overall project, what is the latest time to begin a given activity, without causing any delay to the project?
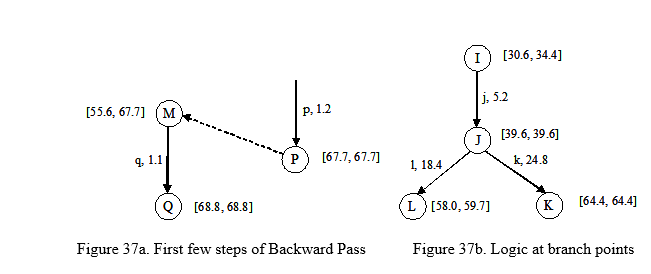
Certainly, the project cannot be completed before 68.8 weeks. The last activity that we perform is q, which takes 1.1 weeks and cannot begin until all other activities are done. Thus if q is stated at any time after 68.8 – 1.1 = 67.7 weeks, then the project will get delayed. Since the start of activity q is at node M, we write this limit, 67.7, in the square bracket next to node M (see Figure 37a).
The latest allowed start time for each node is worked out using this logic. The only case where we need to pay some attention to this process is depicted in Figure 37b. Node L indicates that activity l¸ whose duration is 18.4 weeks, must be completed no later than 59.7. Therefore it must begin at a time no later than 59.7 – 18.4 = 41.3 weeks. Using the same logic for activity k, the latest start time for activity k is 64.4 – 24.8 = 39.6. So which of these two figures, 41.3 and 39.6, is the correct figure for event J ? Clearly, we must pick the smaller of the two numbers – since if we denote the latest time at node J by 41.3, then we could only complete the activity k at 41.3 + 24.4 = 65.7, which will delay the project completion time (if we reach node K at any time later than 64.4, it will delay the project).
Slack time: The slack time for an event is the difference between its latest and earliest time.
Limitations of CPM/Pert Methods
While good in theory, CPM/PERT are sometimes less useful in practice because of two reasons.
- It is often very difficult to estimate the exact time for any activity. Hence most modern PERT methods associate three-time values with each activity: the best case time, the expected time, and the worst-case time. Then a probabilistic model is built, using the worst case, best case, and expected duration of each task. However, such estimates are based on a series of assumptions, many of which may not be practically correct.
- The second problem is that in constructing PERT graphs, we only consider the precedence relations between tasks. However, in real-life projects, several tasks may share some physical resources (e.g. cranes may be used in different tasks during the project). If two or more jobs require the same resource, it may not be possible to do them simultaneously. This type of constraint is not captured by PERT. To consider such cases, we must use a different type of problem model. Such models are studied in a different area of IELM, called resource-constrained scheduling. It is sometimes possible to construct LP formulations of such models.
Reference
R.K. Sharma, Operation Research – Theory and Application, First Edition, Macmillan Publishers.
V.Sunderasan, Resource Management Techniques, K.R. Publications.
Paneerselvam, Operation Research, second edition, Prentice Hall of India.