Introduction
Service firms, just like other firms, have realized the importance of client-centered philosophies and are shifting to quality management designs as part of management practices (Gronroos, 1982). This paper highlights the theory of service quality and shows service quality gap models.
SERVQUAL methodology is used in MacDonald’s meal services analysis to identify the gap between client expectations and perceptions of the service. The focus is directed on MacDonald fast-food’s meal service. The results obtained reflect the primary gaps relating to what the client’s expect and their perceptions of the meal services offered by MacDonald’s fast-foods. This allows for development a framework, upon which prioritization decisions with respect to the gap areas are made.
Quality measurement within the service industry is difficult compared to other areas (Gronroos, 1982). Unlike measurement of quality in products where there are measurable parameters including length, weight, color, and texture, among others, service quality measurement is intangible and mainly involves qualitative specifications (Jacoby & Olson, 1985).
Additionally, clients have their own unique way of perceiving services offered, which significantly vary depending on their previous experience, individual needs, and hearsay. Noting this challenge, researchers have developed a methodology for measurement of quality within the service industry, and named it SERVQUAL methodology (Lehtinen & Jarmo, 2002).
Service Quality
Service quality is a view that has raised significant interest and deliberation in development of quality literature because of the challenges in describing it and measuring it, with no overall compromise emerging on either (Kang, James, & Alexandris, 2002). Various definitions have been proposed to explain what service quality refers to (Kang, James, & Alexandris, 2002).
Most frequently, it is defined as the level to which client’s expectations as well as needs are addressed by a service. It can therefore be described as the gap between client’s expectations of a service and the service perception. When expectations exceed performance levels, the services provided is less than being satisfactory and hence clients are likely to get dissatisfied.
While many persons would wonder why service quality should be evaluated, the answer is simple, service measurement and evaluation allows for comparisons to be before and after implementation of changes, identification of quality issues, as well as, in establishment of the important service delivery standards.
Kang, James, & Alexandris (2002) note that, service delivery should begin with analysis of the service, after which measurement is made. The SERVQUAL model is usually used in evaluation of services and measurement of corresponding quality. This paper evaluates the services offered at Mac Donald’s with respect to meal service provision.
SERQUAL Methodology
Service sector administrators are under constant pressure to show that their services are client-oriented and that continuous performance enhancement is delivered. Given the financial as well as, resource constraints under which service entities must operate, it is vital that client expectations are adequately understood and measured and that, from the clients perspective, existing gaps in service quality are recognized.
This information thereby helps an administrator in identifying cost-friendly means of closing service quality gaps and of prioritization of the gaps to concentrate on. This is crucial given the resource limitations. While a lot of efforts have been directed towards service quality evaluation, there exists no generalized concept of measurement. SERVQUAL has however, shown wider acceptability (Parasuraman et al., 1985; 1988) in the quest to evaluate quality of service.
A fundamental objective of this study is to utilize SERVQUAL instrument in ascertain the perception gaps between client expectations and perceptions of the service provided. Additionally, this analysis will allow pointing out how service improvement management can become made reasonable and assimilated with respect to the prioritized dimensions of service quality.
In this report, a brief service quality review is provided, the model of service quality illustrated, and the SERVQUAL methodology demonstrated with the findings of client expectations and perceptions in MacDonald’s meal services.
SERVQUAL is a representation of service quality as a gap between the client’s expectation of service being offered and the client’s perception of the received service, requiring that the respondents answer questions regarding their expectations as well as perceptions (Parasuraman et. al., 1988).
It is important to point out that the application of perceived, rather than actual service received makes this measurement an attitudinal measure, bearing relation, but not the exact same as, satisfaction (Parasuraman et. al., 1988).
The methodology uses questionnaires to evaluate the level of quality of a given service (Gronroos, 1982). Basically, five dimensions are evaluated. These include
- Tangibility which addresses the physical appearance of equipment as well as the facility
- Reliability
- Responsiveness
- Assurance;
- Empathy.
These dimensions are used in measurement of service quality, both with regards to quality expectation and perception. A scale ranging from strongly disagrees to strongly agree on a range of 1 to 7. The results obtained were recorded in a table and the average of each of the dimensions calculated (see appendix)
On basis of the five SERVQUAL dimensions, survey questionnaires are used as tools for measurement of the gap between client’s expectation for quality and their corresponding perception of service quality level delivered. The SERVQUAL tool assists those offering services to understand both the client’s expectations of meal services and MacDonald’s and the perceptions of MacDonald services, in addition to quality enhancement over time.
Other than the aforementioned, SERVQUAL assists in targeting specific elements of service which require to be improved as well as identification of opportunities for staff training. The information obtained from SERVQUAL application offer rich implications for decision making by service managers.
SERVQUAL Dimensions
MacDonald, being a leading fast-food puts plenty on importance in ensuring that client quality requirements are met within reasonable scopes. In this case, MacDonald’s service organization is evaluated using SERVQUAL questionnaire dimensions. The dimension values are obtained from the questionnaire scores obtained.
These include the scores from the 22 expectations statements and the 22 perception statements. The results are useful in obtaining the gap scores of the respective dimensions. This score is useful in analysis and was calculated based on the following formula.
The average score for each of the five aforementioned dimensions was then obtained via the score for each of the statements constituting the dimensions.
The Gap score acts as a dependable pointer to every single quality dimension used in service evaluation. Using SERVQUAL, will allows determination of how MacDonald has fared with regard to meeting client expectations in terms of service quality and hence highlight the key areas that require improvement.
Gap analysis
The interest of SERVQUAL methodology is to establish the gap between the expected services by the clients and the perceived service received by the clients (Kang, James, & Alexandris, 2002; Lewis & Booms, 1983). The differences indicated failure to meet the client’s expectations or the ability of the organization to meet and even surpass the client’s expectations.
Basically, gap analysis focuses on establishing the difference between what clients expected and what was delivered. This in essence implies that service quality is relative i.e. non-absolute, different clients have different perceptions of service quality levels, and the service quality can either be met, exceeding, or not met. Gap scores
From the table above, there no doubt exists a gap between client expectations and perceptions of the quality of service provided by MacDonald.
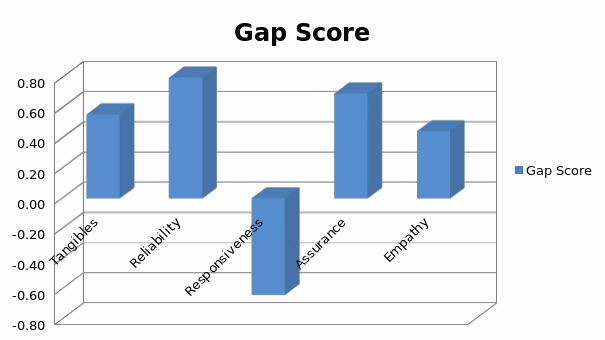
The average dimensional scores recorded indicate that while tangibility (0.56), reliability (0.80), assurance (0.69), and empathy (0.44) show positive gaps indicating that client expectations are being exceeded in this areas, there is no doubt a requirement that something be done on responsiveness (-0.64) which records a negative value indicating that client expectations are not being met.
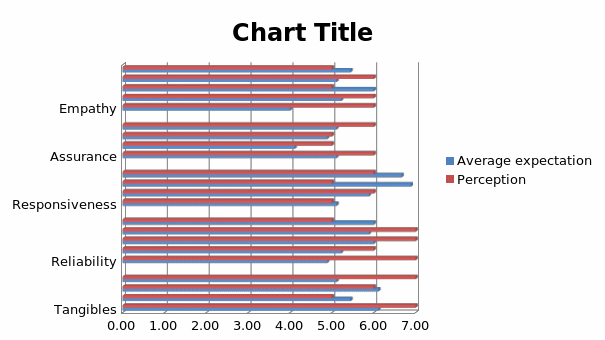
Being a client focused organizations, this observation is a crucial one and requires in-depth consideration if the organization is to maintain success in its operations. Similarly, the weighted score indicates that high priority should be accorded to responsiveness which registers the lowest weighted score. Additionally, the weighted score indicates that empathy should also be given emphasis to ensure it does not fall below the par level. These findings are graphically reflected in the graphs below.

Figure 1: Perceptions versus expectations
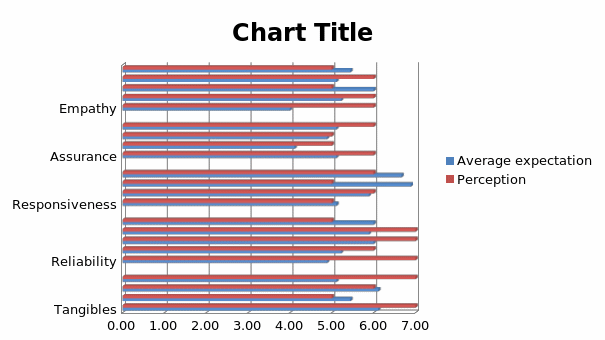
The graph indicates the differences between client perception and client expectation amongst the various elements constituting the quality measurement dimensions.

Figure 2: Two dimensional differencing plane
Score variations
The findings reveal a score variation of 0.56 for tangible perceptions against expectations indicating that the expectations of clients fall below MacDonald’s service levels. This implies that the service equipment at MacDonald’s could in very good conditions and well maintain such that most of the clients find less fault in them.
Additionally, the facilities enabling the service are also possibly of good appearance and hence appealing to client’s beyond the levels with which they anticipated. It is an indication of the administration’s commitment to invest in modern equipment to facilitate service provision.
Another area that could have possibly attributed to the positive outcome is the fact the way employees dress and general organization of the service facility could be excellent and beyond client expectations.
Just like tangible dimension, reliability records a positive average gap score of 0.80. This indicates that client’s expectation has similarly been exceeded. Client’s expectations fall below their service perception. This is a good condition that could likely result into clients returning to the fast-food restaurant frequently.
Kudos in this respect goes to employees for probably being able to serve clients on time and also with precision. It generally indicates that clients have their meals serves in a time shorter that they had anticipated and also have the exact meals they had order brought to them, and of the right quantity. Clients can therefore rely on the services at MacDonald not to interfere with their time schedule.
Like the earlier tow discussed dimensions, assurance dimension similarly scores a positive value of +0.69. This indicates that the service enabling staffs have adequate knowledge of the services they offer. They can easily inform clients the existing menu, the prices and the average duration it would take to serve them.
Clients often feel good when their questions are promptly answered and seemingly, MacDonald’s has trained its employees well on service provision knowledge to ensure that clients don’t get inappropriate answers or their questions. It’s sad for a client to be informed that Hamburg goes for $3, only to be after being served that it’s actually goes at $3.5.
As much as the difference is small, clines will questions the service. However, the results indicate that such incidence is rarely present at MacDonald’s and clients more often than not, get the right answers to their questions.
In terms of empathy, MacDonald’s meal service is no doubt good as a positively value of 0.44 is recorded. This indicates that both employees and clients enjoy a close relation. Generally, the results lead into a presumption that the staff pays close attention to the clients.
This could include helping them find the appropriate place to sit, place their stuff if any and even inquire how they feel being at MacDonald’s. Such gestures make employees fell that they have been given a personalized attention and the establishment respects them.
However, in terms of responsiveness the score is rather disappointing and indicates that staffs are take time to respond to client’s needs (-0.64). This indicates a need for improvement in this area, for instance, it’s worth checking whether after serving clients, the staff are variable to attend to emerging needs like for instance bringing missing salt, or when clients one to order for additional stuff. Open interview questions can helped deduce the specific areas that might require improvement in this respect.

Figure 3: Average gap score for each of the five dimensions

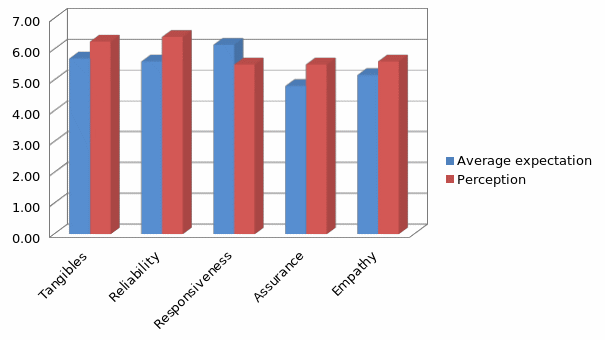
Figure 4: Average gap comparison for the dimensions
The average gaps scores recorded aid in identification of the service shortcomings with regard to the current situation at MacDonald’s. As Lewis & Mitchell (1990) states, the gaps form the basis for making decisions as to which areas which should be given priority is service delivery improvement.
Based on these presentations, the existing challenges can be based on factual observations rather than assumptions. A close observation of gap scores recorded in various aspects of service delivery (fig 2) indicates that in general, the management has been able to address various areas that can lead to client dissatisfaction. The tools successfully reveal the gaps in meal service at MacDonald’s.
Generally, five major meal service quality gaps are evaluated at MacDonald’s. This is an extension of the model proposed by Parasuraman et al. (1985). The first gap addresses client’s expectations against administration discernments: this is often attributed to deprived market investigation alignment, insufficient forward communication and inapt high echelons of administration.
The second gap shows the incongruities in administration perceptions against service measurement as a result of insufficient guarantee to quality meal service provision, a discernment of absence of viability, chore standards observation, and deficiency of goal setting.
Gap 3 on the other hand gives the gap between service requirements versus delivered services, due to role vagueness and conflict, inappropriate employee assignation, and inappropriate technology-work assignment, insufficient supervision mechanisms, in adequacy of perceived regulation, as well as, teamwork inadequacy (Lewis & Mitchell, 1990).
Gap 4 shows the differences in provision of service against the peripheral communication: due to insufficient horizontal communications and tendency to give excess promise, while gap 5 shows the discrepancies in between client expectations and their perceptions of the services provided: due to the influences put forth from the client side and the underperformances (gaps) on the part of the service offering entity (Lewis & Mitchell, 1990). In such a situation, client expectations are swayed by the degree to which individual needs are met.
Conclusion
The research, measuring quality of service at MacDonald’s has focused principally on meeting or exceeding the external client’s expectations, and has therefore looked at service quality as a measurement of the extent to which the service delivered is aligned to the client’s expectations.
This approach is also applicable to MacDonald employees and hence the major gaps can be bridged based on the findings of this research. The concept adopted in measurement of the gap between client expectations and client perceptions based on the SERVQUAL gap score has proved very productive for assessment of service quality thresholds.
The information can assist the administrators in diagnosis of areas where performance improvement is necessary. Additionally, the information can adequately form the basis for performance improvement prioritization (weighted score). This function is facilitated by the largest negative gaps, alongside the areas where expectations are highest.
Appendix: SERVQUAL questionnaire results and summary
References
Gronroos, C. (1982). Strategic Management and Marketing in the Service Sector. Swedish School of Economics and Business Administration, Helsingfors.
Jacoby, J. & Olson, J. (1985). Perceived quality. Lexington: Lexington Books.
Kang, G.D., James, J., & Alexandris, K. (2002). Measurement of internal service quality: Application of the SERVQUAL battery to internal service quality, Managing Service Quality, 12 (5), pp. 278-291.
Lehtinen, U. & Jarmo, R. (2002). Service quality: A case study of quality dimensions. Finland OY: Service management Institute.
Lewis, B.R. and Mitchell, V.W. (1990). “Defining and measuring the quality of client service”, Marketing Intelligence & Planning, 8 (6), pp. 11-17.
Lewis, R.C. and Booms, B.H. (1983). “The marketing aspects of service quality”, in Berry, L., Shostack, G. and Upah, G. (Eds), Emerging Perspectives on Services Marketing , American Marketing Association, Chicago, IL, pp. 99-107.
Parasuraman, A., Berry, L., Zeithaml, &Valarie, A. (1988). SERVQUAL: A Multiple-Item Scale for Measuring Consumer Perceptions of Service Quality. Journal of Retailing, 64, 1, 12-40.
Parasuraman, A., Berry, L., Zeithaml, L., & Valarie, A. (1985). A Conceptual Model of Service Quality and Its Implications for Future Research. Journal of Marketing, 49, 4, 41-50.