Introduction
The purpose of this report is to compare financial data of Saudi Telecom Company and Mobily in order to identify attractive company to invest. However, this report concentrates on the company overview, investment analysis theories of alternatives returns, financial indicators and performance STC and Mobily, competitive advantage, comparative risks and returns and so on.
Background of Saudi Telecom Company (STC)
According to the annual report 2010 of STC, this company was started its operation in 1998 as a Saudi Joint Stock Company and it was wholly owned by the Government of KSA and in 2002, the Government sold 30% of its shares. To sustain as a market leader in Saudi, STC has design its future “FORWARD” strategy and long-term investment plan considering seven dimensions proposed policy, where every letter of the word “FORWARD” has a meaningful strategic and significant message in order to reach the its targets and objectives (STC, 2011).
However, STC is a mega telecommunication company running its ongoing national and international operations based on some core corporate objectives and its mission is to exceed its customers’ expectations by providing service with respect, sincerity, obligation, collaboration, loyalty and so on (STC, 2011).
Table 1: Financial Overview of STC.
Background of Etihad Etisalat Company (Mobily)
The second mobile service provider Etihad Etisalat was established Pursuant to the Royal Decree no. M/40 and started its commercial operation in 2005; however, Mobily is the commercial trade name of this company. Mobily operates with huge success from the very beginning; for instance, this company attracted more than 17.0 million subscribers within 6 months of its operation and its net income was SAR 2.09 billion or US$ 557m in global recession (Mobily, 2011).
According to the annual report 2010, Mobily’s network covers most of the urban areas in the KSA and over 22000 kilometer of highways, and it is expected that Mobily would show more strapping growth in near future by reshaping its strategies and amplify its marketing investments to enlarge the network exposure with competence of 3.5G services. However, STC has aimed to capture the Saudi market with different value added services and strong strategic network of vendors while Mobily has concentrated on more technological development to achieve lion market share, for instance, its GSM coverage is 97% populated regions and 3.75G coverage is 80% of populated areas.
The company is running upon the broader vision of keeping its leadership functional orientation all over the world where people would be able to touch the family and distance could not keep them apart. Motivated by such vision, corporate missions can be summed up as offering standard customized value, obtaining the top communications entity in Saudi Arabia by actively developing advanced networks.
Table 2: Financial Overview of Mobily.
KSA Potential
STC was the monopoly player of Saudi telecom industry though Saudi Telecommunication sector was become too competitive due to offers the third GSM license and KSA allows private operators such as entering Mobily in this market was destroyed STC’s monopolization. In addition, STC has lost additional market share because foreign companies entered the market with heavy investment after WTO accession; however, the market is still potential for the operators as BMI forecasts that total of 5.5mn fixed-lines in service, 22mn mobile subscribers, and 5mn internet users in KSA within 2008.
Investment analysis theories of alternatives returns
IRR (Interest Rate of Return)
Hypothetically, IRR is a critical measure of capital budgeting that strongly correlate with the NPV (Net Present Value) to assess whether there have any investment opportunity or in another word, present value of cash inflows is competent for a new investment. According to the annual report 2009 of STC, the IRR of this company is 29%, which indicates its long-term profitability.
NPV (Net Present Value)
In net present value analysis, the most important measurement is the time value of money, which measures the present value of single currency, which may be received in future and similarly the money received today may have more value in the future. There are some factors, which affects the present value including the time when the expenditure taken place and the rate of discount. When the discount rate is high, the present value is low and when the discount rate is low, the present value is high. However, TIAB Research reported that the net present value of the cash flow of STC in at the end of 2010 was SAR 30,277 thousands, which assume to be a good figure for the business because net present value is the discounted value of the future and it specifies the present value of the money, which may get in future.
Yield
The term yield is also refer as the dividend yield and is an assessment mode to quantify required rate of return of the investors from ordinary shares of an organization. In another word, for an ordinary shareholder yield is an approach to compute value of profit return towards the shareholders’ investment on the company in terms of dividend payment. During computation of yield, dividend against each share at the end of a fiscal year and market price for every share during that period is essential. Lower dividend rate is healthier for an organization’s higher profitability. In accordance with following dividend yield table of STC and Mobily, it has revealed that STC holds high dividend than Mobily and hence it can be noticed that Mobily has enjoyed greater profitability than STC (Pietersz, 2011).
STC
Here is the calculation table of the yield or dividend yield of STC at the end of 31 December 2010. (STC 2010)
Table 3: Dividend Yield of STC.
Mobily
Here is the calculation table of the yield or dividend yield of Mobily at the end of 31 December 2008, 2009 and 2010. (Mobily, 2010)
Table 4: Dividend Yield of Mobily.
Stock
This part of the paper has assigned to demonstrate stock profile of STC and Mobility in the light of the Saudi Stock Exchange (SSE) transactions as well as competitive scenario of the “Telecommunication & Information Technology” industry of the SSE. Regarding this view these two cases has illustrated here including major stock market data along with common financial information (Zughaibi & Kabbani, 2011).
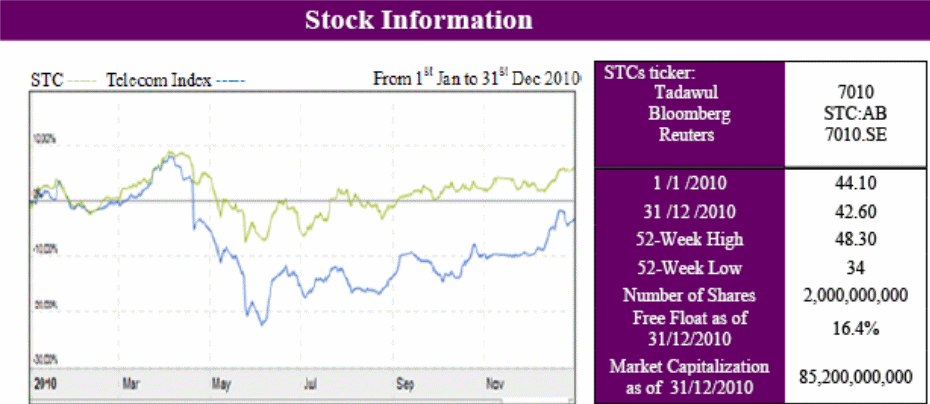
STC: primarily STC is a public owned company with large capital volume in the Saudi telecommunication industry. Currently, amongst four telecommunication blockbusters, STC holds market leader position and following are the key stock information of the company (Zughaibi & Kabbani, 2011).
Table 5: STC Stock Profile.
Mobily: Mobily is an UAE telecommunication company that has started to operate in the Saudi telecommunication industry since 2004 and at the end of five years operation in Saudi market, Mobily has positioned as the second market leader of the SSE as well as the Saudi telecommunication industry (Zughaibi & Kabbani, 2011).
Table 6: STC Stock Profile.
Comparative Stock Profile of STC and Mobily: for more clarification, here is the stock profile comparison of STC and Mobily.
Table 7: Stock Profile Comparison between STC and Mobily.
Financial Indicators used by STC and Mobily
literally, financial indicators are of five categories namely,
- profitability,
- cash flow,
- leverage,
- liquidity profile, and
- forecasting.
Since both of two cases are operate in the similar industry, therefore STC and Mobiliy have required utilizing all of the five financial indicators to delivering best performance. Alternatively, all of these financial indicators are design to fulfilling any organization’s mission, vision and objectives and from this view, financial indicators of STC and Mobily has aligned to their market operations, outcome from the pursued benchmark and finally, rewarding on performances. Both the telecommunication firm has regularly assessed their financial performance through profitability, cash flow operation, leverage profile along with the liquidity ratios.
Consequently, gathered performance data has accumulated in order to forecast organization’s new goal and objectives as well as expansion of market segment. On the other hand, point should to note that both the company has mostly emphasized on profitability as performance indicator in order to improve their margins gradually. Finally, financial indicators of two firms evaluated their performances by two indicators enhance growth of operational performance along with indirect sources of revenue generation therefore it would easier to minimize risk factors as well as ensure a sound return on equity. For more clarification, following are the financial indicators used by STC and Mobily (Bausman, 2008).
- STC: here is the list of financial indicators used by STC (STC, 2010)
- Fair Value: STC and their associate groups considered fair value as a financial tool during asset exchange as well as refund of liabilities. STC reported that volume of their fair value has not yet greatly fluctuate in between 2009 and 2010. Key attributes of fair value involved in
- record of short–term assets and liabilities (Cash & Cash Equivalents, Accounts Receivables, Accounts Payables and Other Debit and Credit Balances),
- mobilize share market and
- assist government bonds as well as credits to figure out a reliable discounted cash flow.
- Commission Rate Risk: The commission rate risk is an indicator to evaluate financial position of STC Group along with cash flows. Executives of STC Group have performed to make a balance between cash inflows and outflows therefore future investments will be flexible along with sound bank deposits.
- Currency Risk: another financial indicator that involved in monitoring fluctuation of foreign currency rate and recommend whether foreign reserve should to minimize in exchange of STC official currency SAR (Saudi Arabia Riyal) against USD ($).
- Credit risk: principally, credit risk has obliged to consider two issues cash balance and accounts receivable. In this regard, STC Group has always keep attach with the highly credit rated financial entities for a sound deposit balance and conversely, STC has not yet disclose their accounts receivables since of diverse consumer market (Residential, Professional, Large Business & Public Entities).
- Liquidity Risk: a financial indicator to resolve financial crisis by increase of cash balance and the liquidity risk factors have monitored periodically to keep sound balance to prevent future difficulties.
- Mobily: in order to design financial indicators and their proper utilization during crisis Mobily has ranked several financial indicators similar to STC in accordance with the accounting policies of the SOCPA (Saudi Organization for Certified Public Accountants) where both short term and long term debts and assets are categorized separately. Here is the list of financial indicators used by Mobily (Mobily, 2010).
- Fair value: Mobily represents their fair value in accordance with the current value of consolidated assets and liabilities and Executive Team of Mobily Group apprise that consideration of fair value is one of the most effective financial indicators to minimize potential risk factors.
- Credit Risk: primarily credit risks have involved with the entire financial assets (Cash & Cash Equivalents, Short–Term Investments, Accounts Receivables & Other Assets) as a result, investments of Mobily has featured with high credit rates and for this reason they have enjoyed a limited credit risks.
- Foreign Exchange Risk: similar to STC, Mobily Team Management has also continuously monitor fluctuation of foreign currencies therefore it would be easier for the Group to execute significant financial commitments during currency crisis.
- Mudaraba Rate Risk: though Mobily has not yet required to consider significant mudaraba rate risk but they are enough conscious to monitoring current mudaraba cost in accordance with the bank announcement as well as recent market rates during acquire short and long term debt. Alternatively, regular monitoring of the mudaraba data of Mobily, work as a financial indicator to prefer lower mudaraba as well as other interest rates.
- Liquidity Risk: evaluation of liquidity risks privileged Mobily’s in this way that they are now enough expert to reviewing their available funds, strongly monitor of cash inflows and outflows, maintenance of assets and liability maturity dates and hence enable to resolve any liquidity crisis efficiently.
Performance of STC and Mobily
Financial Status
Credit Rating
The term credit rating has involved to assesses firm’s short term and long term investment potentiality considering market capital position, debt ratio, self leverage ability and growth rate. In accordance with the following discussion it has evaluated that STC and Mobily is two tough rivals in the Saudi telecomm nation industry though Saudi is surging market for telecommunication. In the light of STC and Mobily credit rating profile, STC has better position for investment.
- STC: in accordance with the S&P5 credit rating services, STC has labeled through a high credit rating of A+ for the long-term investment and AA for short-term investment. Considerations of S&P for the credit rating are included
- a) comparatively low leverage amongst its associate market competitors and
- b) lower debt to EBITDA6 ratio.
- Besides these two issues, there have a set of attributes of STC to rank them in a high credit rating profile and STC has, strong market position in the Saudi telecommunication industry, more specifically, currently STC is the market leader of Saudi telephony operator. Other than, S&P credit rating, Saudi government has also frank to provide implicit financial support for self leverage. Though STC has continued a conservative financial policy, earned a lower growth but increasing competition in this industry has potentiality of several meaningful investments. Conversely, prospect of overseas M&A7 would be influence credit quality of STC. Regarding all of these issues as well as low debt profile currently, STC has rated as AA-/Stable/A-1+ (Alacra Inc, 2011 and TIAB Research, 2010).
- Mobily: similar to STC, S&P credit rating services defines Mobily as AA for long term investment and BB for the short term investment. Currently, Mobily is the second largest telephone service provider in Saudi Arabia and their dominant market segment is mobile broadband. In comparison between STC and Mobily, Mobily is too close rival for STC with a strong growth rate. More specifically, at the end of 2010, sales growth of Mobily was 26.0 % acquiring net profit of 39 %. Conversely, similar to STC, Mobliy has also holds a lower debt to EBITDA ratio. On the other hand, in recent time influence of political disaster in Arab region, performance Mobily grow slower and according to the Saudi TASI (Time Assignment Speech Interpolation) index Mobily underperformed by 4.0 % at the end of 2010. Despite a satisfactory credit rating position as well as business attributes Mobily is now under threat of political turmoil and compete in a surging telecommunication market of the Saudi Arabia (Al Rajhi Capital, 2011).
Capital
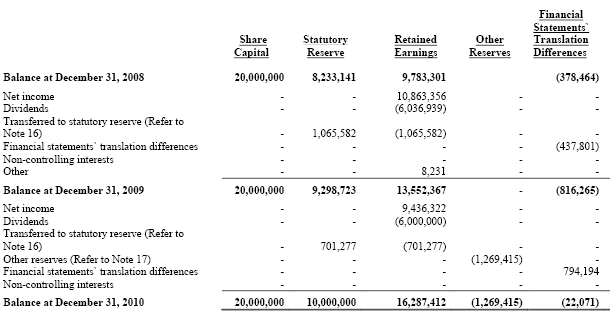
STC: the capital profile of STC has primarily formed through two sources namely, issue of share capital and statutory reserve. At the end of 2010, 70.0 % of share capital of STC has owned by the Government where aggregate company capital value is SAR 20,000 million. To generate capital value STC has issued 2000 million shares by book value of SAR 10.0 each share. Alternatively, in the light of AA (Articles of Association) of STC, statutory reserve represents that 10.0 % of total income of a year should to be quantify as the statutory reserve and additionally, this reserve should to be equivalent half (50.0 %) of issued share capital.
Conversely, statutory reserve should not be quantified during distribution of shareholders’ equity. For instance, at the end of 2010, statutory reserve of STC was about SAR 10,000 million that represents 50.0 % of issued share capital where as it was 46.50 % or by SAR 9299 at the end of 2009. Then again, STC has committed to improve their business volume by expansion of capital expenditure and therefore, capital expenditure of STC was SAR 3,498 million in 2010 along with aggregate rent expanse SAR 633 million. (STC 2010)
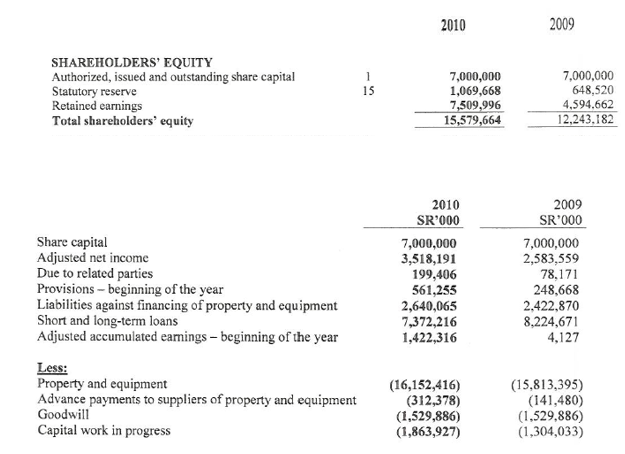
Mobily: alike STC, Mobliy has also assembled their capital profile through two sources share capital and statutory reserve. According to the financial statements of Mobily, at the end of 2010 it holds SAR 7.0 billion share capital where number of fully paid ordinary share is 700.0 million, SAR 10.0 for each share. Alternatively, statutory reserve is approximately SAR 1069,688 and retained earnings amounted SAR 7509,996.
Compare to STC, Mobility has not yet reconciled their AA to make obligatory what would be the ratio of statutory reserves compare to the value of share capital. Considering value of property and equity of the firm, capital assurance and emergency has declared to expanse of SAR 1.65 billion and in defining capital profile of Mobily it has to notice that Mobily and its subsidiaries has occupied 67.0 % of their entire project values where contingent liability of Mobily subsidiaries is approximately SAR 110 million. (Mobily, 2010)
Ratios
Performance ratios of any firm appraised how efficiently the firm able to return their valuable investments (STC 2010, Mobily, 2010 & Panday 2010)
STC: following is the table of performance ratio calculation of STC at the year ended 2010 –
Mobily: following is the table of performance ratio calculation of STC at the year ended 2010 –
Market Share
In comparing investment attractiveness of STC and Mobily, market share is the determinant of their competitive strength in the telecommunication industry of Saudi Arabia. Alternatively, market share has also illustrated two companies’ performance profile gradually. In accordance with the SSE, STC and Mobily has ranked top two positions respectively. On the other hand, literally, market share is also define four major issues of a company namely,
- competitive product line,
- competitive pricing strategy,
- marketing incentives and
- supply chain approach.
These forces have also a comparing tool to illustrate competitive challenges as well as opportunities amongst the rivals. Following is the market share profile of STC and Mobily.
STC: since April 1998 STC has establish in the Saudi telecommunication industry offering three services namely,
- landline,
- mobile and
- Internet.
On the other hand, in order patronize their service sectors STC has operated fiver key business sectors and they are
- Al Hatif (Landline Services, Card Phones, Public Telephones, Prepaid Card Services & Business Services),
- Al Jawal (Offers a range of mobile services including Family Al Jawal, Sawa messaging Services, Business Services, Data Services & Roaming Services),
- Saudi Net (An Internet Provider),
- STC Online (For electronic bills payment services) and
- Saudi Data (A provider of data solutions).
For a comprehend market share profile of STC, following is the table featuring major market share issues. (Zughaibi & Kabbani 2011)
Table 10: STC Market Share.
Mobily: December 2004, Mobily an UAE mobile company has entered into the Saudi telecommunication market and after five years of their operation Mobily has earned the second market leader of Saudi. Since beginning of operation in Saudi Mobily has composed their ownership as a dual venture, where i) Saudi government has owned 40.0 % as public investor, ii) 26.25 % has hold by Etihad Etisalat the official brand of UAE and finally, rest of 33.75 % share has seized by Mobily SA. Here is the key market share attribute table of Mobily.
Table 11: Mobily Market Share.
Economic View
Competitive advantage of STC
It refers to the features those are exceptionally practices and mostly possessed by STC and some of such advantages are –
- Implementation of innovative motive in regular activities in terms of thoughts, values, beliefs and stimulations for developing community growth and personal welfare;
- Following customer-focused strategy and delivering advanced technological services to make customers’ life easier;
- From 2009, STC introduced new facilities by which customers would be able to see their bills, print and pay them via the Saudi network (SPAN);
- Agreement with Oracle Systems Ltd gives the opportunity to implement Oracle products such as Enterprise Resources Planning (ERP) to develop customer relationship management, and HRMS, E-Commerce facilities;
- Comparatively lower fixed- line penetration.
- Opportunity for using multi- SIM cards,
- The aim of STC is to develop good relationship with the vendors; as a result, STC is using the Vendor Relationship Management System (VRMS)
- Maintaining outstanding CSR policy, which is helping the company in creating positive public image about their services;
- One of the key competitive advantages of STC is unique networking facilities than other competitors.
Competitive advantage of Mobily
Mobily has enjoyed several competitive advantages in short period of its operation and Mobily follow generic business method and TQM (Total Quality Management) philosophy to extent its advantages.
- Etihad Etisalat awarded KSA’s first 3G and second GSM licenses and Mobily intriduces commercial GSM services in 32 cities with 79.2% local population;
- In addition, this company first launched 3.5G service;
- Agreement with ITC and Bayanat Al-Oula in order to develop 12,600 km high quality fiber optic network;
- Supply chain management system is outstanding as Contract with outsourcing parties is enough flexible for supply chain management; as a result, Mobily available above 3600 points of sale;
- In case of speed and utility, Mobily has a set of innovative mobile functions and GPRS facilities.
- As key success and enjoy competitive advantages are mostly comes from high customer satisfaction, Mobily has already created large number of customer base like 300,000 HSPA subscribers signed up within FY2008;
- In comparison to other operators, Mobily offered its products and services at lower price.
Expansion
STC and Mobily are efficient with their organizational structure, strategy, experience, corporate social responsibility, and corporate practices in the national and international market. Therefore, both companies are eager to expand its business operation all over the world, so they are following acquisition strategy to expand their business in neighboring countries and help to obtain comparative uniqueness in terms of market shares, customer services, selling its products, networking, and annual financial development.
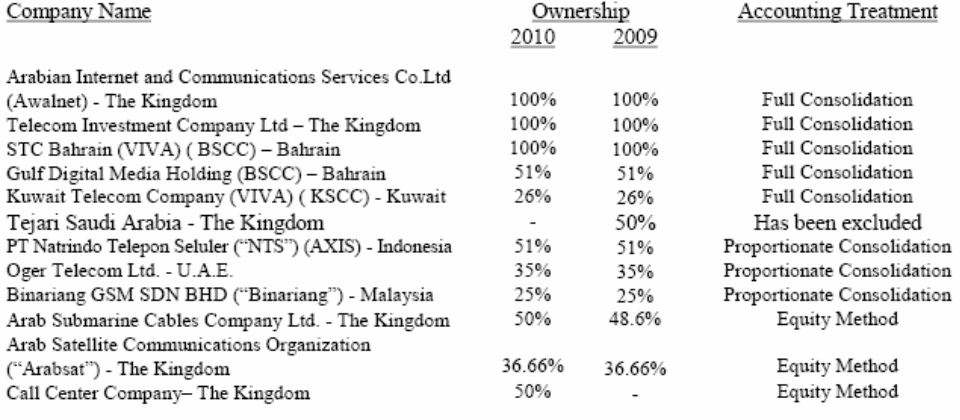
The historical framework of STC and Mobily demonstrates that they would like to make joint venture and acquisition as overseas market entry strategies though Kotler & Keller (2006) stated that there are many ways in entering into a foreign market, for example incorporating exporting, joint venture, FDI, licensing, franchising, and acquisition.
However, STC introduce its Global Network (SGMN) and Points of Presence (PoPs) in 2010 to operate in Middle East countries as a market leader with significant market shares. The following figure demonstrates its joint ventures and other strategies to inter foreign market –
Marketing View
Advertising
STC: In order to increase customer base and attract more customer, this company spends huge amount of money for advertising and other promotional activities form the very beginning; for example, its total advertising costs was about SR 2,360,389 thousands.
Table 12: Advertising Costs of STC.
Mobily: On the other hand, Mobily always follows cost effective strategy and it would like to offer lower price; as a result, it spends only SR 576,301 thousands in 2010 for advertisement program.
Table 3: Advertising Costs of Mobily.
Customer services
Both STC and Mobily would like to provide high quality of customer services and they highlight more on customer care in order to retain more customers by increasing customer loyalty; as a result, both companies have taken measures accordingly, for instance, STC contacted with Oracle Systems Ltd to develop customer relationship management system.
Good well (brand name)
The intangible assets Goodwill is recorded at cost and it arises on the acquisition of stakes in subsidiaries and joint ventures; however, the following table would give a clear perception of both companies –
Table 13: Goodwill of STC & Mobily.
Products
Kotler & Keller (2006, p.19) stated that product or service is the core offering of a manufacturer or service providers where the variety, quality, design, features, brand name, packaging, sizes, warranties, and returns are concerned and Kotler & Armstrong (2005, p.34), the product is any kind of offering, which can be a physical object, service, firm, person, and so on.
According to the annual report 2010 of Mobily, the key activity of Mobily is to establish and operate mobile wireless telecommunications network, fiber optics networks and provide Telephony, Data, Fixed, and Mobile Telecom Services, mobile push-to-talk service (PTT) and walkie-talkie facilities, and introduce franchise retail concept (Mini-FBO). Mobily also provides many services like quality of Service (QoS), version-6 Internet Protocol network, secure Data Center, IP Transit Service, IP VPN (Virtual Private Networking through Internet Protocol) service, Bulk Data SIM Cards, Control Line, state-of-the-art Tata Communication and many other services (Mobily, 2009, p.18).
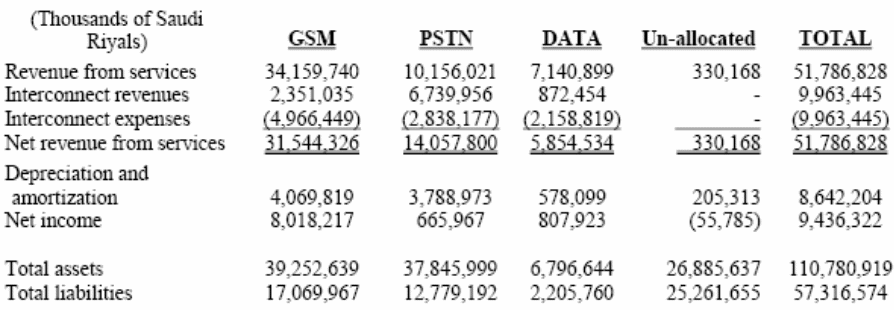
On the other side, STC mainly provides four types of products and service facilities to its customers while Mobily is giving various options to its customers to choose various types of products. However, the following figure shows net income from different segment –
Comparative Risks and Returns
Ratios
Comparative risk and return ratios of a business firm assesses its debt return, balance between asset and liability, interest coverage time, profitability, earning per share (EPS) and price-earning ratio (P/E). Considering all of these risk and return factors following are the assessment table of STC and Mobily. Comparison of STC and Mobily noticed that compare to STC Mobily has enough efficient to recover their risk factors as well as sound return against investment.
STC: here is the table of comparative risk and return ratio calculation at the year ended 2010. (STC 2010)
Table: STC comparative Risk and Return Calculation (Source: STC 2010, Gulfbase.Com 2011 & Panday 2010)
Mobily: here is the table of comparative risk and return ratio calculation at the year ended 2010. (Mobily, 2010)
Table 15: Mobily Comparative Risk and Return Calculation.
Financial Leverage
Literally, financial leverage is an assessment process of capital structure of a business firm. This paper has assigned to compare investment attractiveness of two telecommunication firm STC and Mobily. Regarding this view, calculation of leverage ratio of these two companies has illustrate their current capital structure therefore interested investors would easily choose right investment place. In accordance with the following leverage table of STC and Mobily it has assessed that in most of the cases STC position is enough sound than Mobily. Considering this view, it would better for the interested investors to prefer STC rather than Mobily. (Pandey, 2010)
STC: here is the calculation of STC financial leverage for the year ended 2010.
Table 16: STC Financial Leverage Calculation.
Mobily: here is the calculation of STC financial leverage for the year ended 2010.
Table 17: Mobily Financial Leverage Calculation.
Conclusion
This paper has assigned to assess investment attractiveness of two-telecommunication Company STC and Mobily to decide whether investment would be better. In accordance with the company profile, STC is a Saudi public limited company where 70 % of their share has owned by government as well as huge investment support. Conversely, Mobily is a UAE origin company of official brand name Etihad Etisalat where 40 % share owned by Saudi government.
During investment decision making it has appraise that most of the financial indicators of STC is comparatively sound than Mobily. In recent political turmoil in the Arab Region, both the firm has failed to achieve their target net profit margin.
On the other hand, in caparison of profitability Mobily has currently enjoyed high profitability than STC since of lower dividend yield. Conversely, risk and return position as well as market capital, share market profile are much stringer of STC than Mobily. Additionally, in case of leverage structure and credit rating profile, STC is also superior than Mobily as well as has sound self leverage efficiency. Considering three investments attribute, credit rating, risk, return profile, and share market profile it has assertively affirmed that STC is sounder than Mobily to invest under the current market position.
Reference List
Alacra Inc (2011) Saudi Telecom Co. from S&P Credit Research. Web.
Al Rajhi Capital (2011) Equity Strategy Research Saudi Arabia. Web.
Bausman, D. C. (2008) Key Financial Indicators and the Drivers for Success Best Practices. Web.
Mobily (2010) Consolidated Financial Statements and Auditors’ Report for the Year Ended. Web.
Mobily (2011) Etihad Etisalat “Mobily” Saudi Arabia. Web.
Pandey, I. M. (2007). Financial Management. 9th ed. New Delhi: Vikas publishing house Ltd.
Pietersz, G. (2011) Dividend yield. Web.
STC (2010) Consolidated Financial Statements for the Year Ended December 31, 2010. Web.
STC (2011) Investor Relations. Web.
STC (2011) Mission, Values, Responsibility and Strategy of Saudi Telecom. Web.
TIAB Research (2010) Saudi Telecom Company. Web.
Zughaibi, K. & Kabbani, B. (2011) Etihad Etisalat Company (Mobily). Web.
Zughaibi, K. & Kabbani, B. (2011) Saudi Stock Exchange. Web.
Zughaibi, K. & Kabbani, B. (2011) Saudi Telecom Company (STC). Web.