A monopoly is a market structure characterized by only one supplier but many buyers. The one firm which supplies the entire market has enormous market power to determine both the price as well as the quantity supplied to the market.
In the process, they not only produce at high prices in comparison with a competitive market structure but they also produce less than the optimum quantities required in the market. The monopoly firms thus make super normal profits and are considered inefficient.
The main causes of the existence of monopolies are the barriers to entry resulting from several factors. First are the natural monopolies which occur due to the fact that only the firm is able to access resources used in the production of the final product.
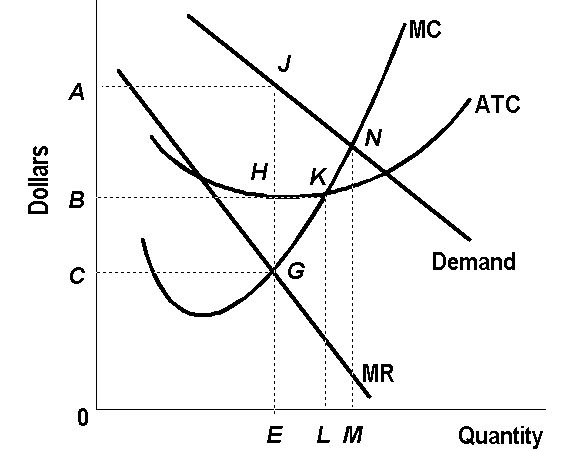
Factors such as high cost of entry, government policies as well as limitations in technology also lead to the existence of monopolies (Price and Output under a Pure Monopoly, 2010, para3). The graph below depicts the monopoly market structure.

Notably, the Marginal Revenue curve is downward sloping as the firm can determine both the price as well as quantities. It is also important to note that all firms produce at the point where the Marginal Revenue Curve (MR) meets with the Marginal Cost curve (MC).
Total Revenue (TR) refers to the entire inflow of revenues resulting from the firm’s economic activity. By this definition, the TR can be derived by obtaining the product of the total quantity (Q) sold by the price (P) at which they are sold at. Consequently, TR=P*Q.
From the graph above, the price follows the Y-axis while the Quantity follows the X-axis. Again, the demand curve is the path along which the firm must produce. Bearing in mind that MR must equate to MR, then, the firm is producing at point J which represents Quantity E and Price A.
Therefore, the equation TR=P*Q is represented by the Rectangle 0EJA which is the total revenue of the firm.
Total Cost (TC) on the other hand refers to the sum of expenditure incurred during the production of the quantity produced by the firm. It is the product of the Average Total Cost (ATC) and the total quantities (Q) produced. Consequently TC=ATC (Q).
At the level of production E, the TC is defined at point H by the Rectangle 0EHB. Profits (n) refer to the excess of Total Revenues over Total Costs. That is
n = TR-TC
In the Graph, The difference can be interpreted as the difference between Rectangle 0EJA and 0EHB. This is represented by the Rectangle BHJA.
The case of a firm operating in a perfectly competitive market structure differs from the monopoly mainly due to the fact that the firm cannot determine the price or the quantity due to the presence of many buyers and many sellers.
The MR curve equates to the demand curve at a level where MR which defining the level of price. Notably, the competition ensures that the firms produce at the levels where the average cost curve is at minimum.
Therefore production is done at the level where MR=AR=AC=MC. In the graph the point would be K where the level of output is at L. Clearly, this level of output is higher than in the case of a monopoly.
Reference List
Cooperative Games, (2010). Learningforlife. Web.
Osborne, M., (2007). Nash Equilibrium: Theory. Web.
Price and Output under a Pure Monopoly, (2010). Tutor2u. Web.