Introduction
The question regarding industry performance and company performance has been discussed by many scholars (Collis & Montgomery, 1995; Porter, 1996). The industry performance was strongly related to the firm’s performance in a competitive environment in the erstwhile economic literature. But strategists and economists of the nineties think otherwise and argue that it is the intrinsic feature of a company to succeed or fail. This paper discusses these arguments and tries to find out which of the arguments hold true and which do not. For this purpose industry level total return on shareholder value in percentage terms are derived from the Morningstar database. From this database the best and the worst-performing industries are considered and analyzed. From this, the paper derives answers to questions like if some companies in the best performing industry in long run can perform badly, while some companies do well in industries that were not doing so well. This paper answers the why and how questions related to good performing and bad performing companies.
Identify industries
Exhibit 1 shows the top 3 and the bottom 3 companies according to their performance for a short run period. The top 3 companies are electronic stores, education and diagnostics, while the bottom 3 companies are coal aluminium and radio. Exhibit 2 presents the long-run performance of the top 3 and bottom 3 industries. In this respect, there is a discrepancy between the top 3 and bottom 3.
Exhibit 1: Total return of top 3 and bottom 3 companies for 1 year, source morningstar
From the two tables, it is clear the industries which are related to technology, health and development tend to be better performers in the short run. In the long run, the industries related to agriculture, business or online services, and iron and steel are better off. The reason being agronomics and iron/steel industries see their return in the long run as they require a higher level of infrastructural and initial capital investment for which the return remains low in the short run. Further industries like electronics, education require a low level of capital investment and that is why the short-run returns for these are higher.
Exhibit 2: Top 3 and bottom 3 comlnies in long run, source Morningstar
In the short run the industries which are in the bottom three are coal, aluminium and radio. This is so because these are industries related to the care sector and are dependent on fixed resources. As the availability of the resources become low, so do the returns in the short run. But in the long run, these industries are better off than oil/gas. Oil/gas has been in the bottom three even in the long run due to the global oil crisis and the increasing prices of oil which has affected the industry badly. Further, the supplier power in the industry is very strong due to the presence of OPEC which cartelizes oil trade and thus affects the industry adversely. The radio industry has been performing badly both in the short and well as long run. The reason is technological advancement. Radio has become a technology of the past. Due to the reduction in demand for the product and the advent of new technologies, like the iPod, the industry has been affected. Similar reasoning can be applied to the wireline industry. This is the age of wireless so wirelines have become obsolete.
Identify Companies
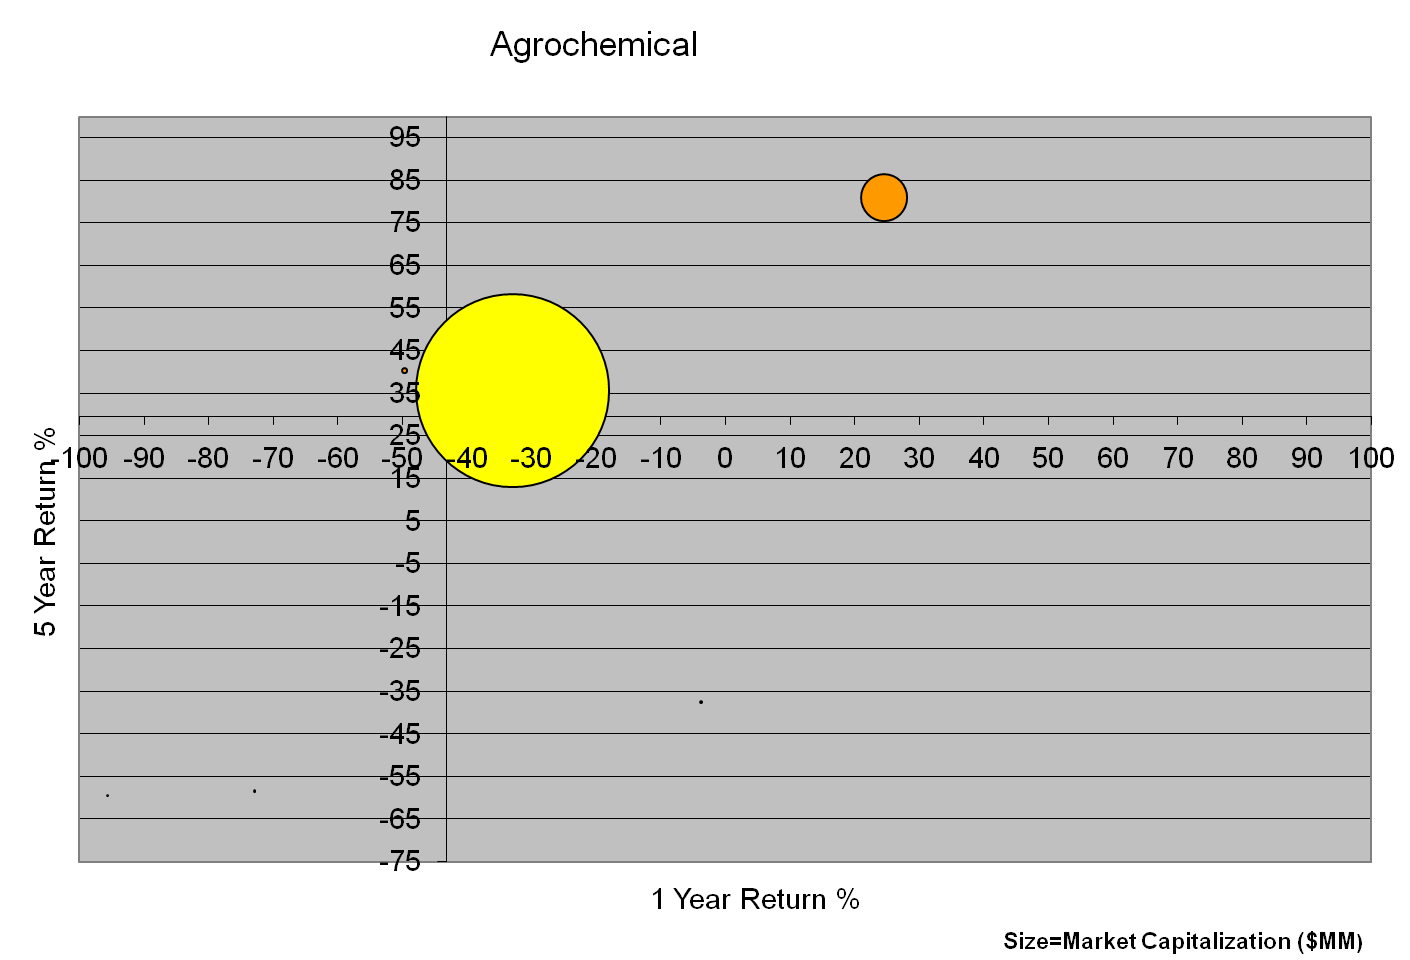
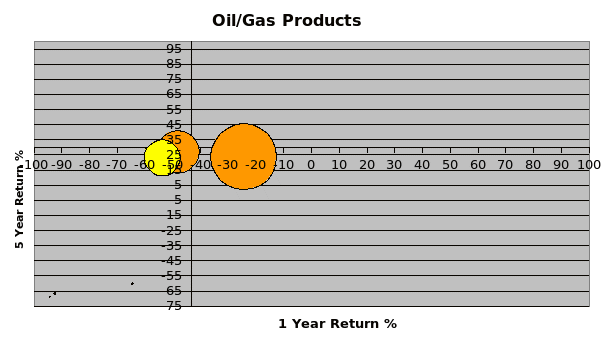
After reviewing the best and the worst-performing industries in the long and short run, the paper concentrates on the companies in the best performing and worst-performing industries in the long run. Three best performing companies and worst-performing companies from each are taken. A bubble chart is drawn for each (see exhibits 3 and 4).
Exhibit 3 shows that the top companies which operate in the agrochemical industry are demonstrated in the bubble chart the rest are not seen in the chart. Exhibit 3 shows that in the agrochemical industry the top companies have the largest market capitalization which is taken as the size of the bubble indicating that the companies hold the largest market share and strength in the market. Thus they have a strong power over the buyers and sellers and thus ahs a competitive advantage over other competitors. Thus the chart shows it is the top industries that are growing fastest due to top resource-based advantage and thus other companies are lagging. So the companies which do not have access to the resources are lagging in the industry, even though the external environment of the companies, per se the industry is functioning well. The chart shows that the company which does the best has an average performance in the long and short-run and which remain unaltered. Exhibit 4 shows the top 3 and the bottom 3 companies in the worst-performing industry in the long run i.e. oil/gas industry. The chart shows that the best performing industry in the industry is clustered around the same area signifying the basic resources for these industries are derived from the same source and have similar operational modes. But the worst-performing companies are scattered in the chart with very small bubbles indicating dissimilar resources and strategies of operation.


This shows that the best performing industries have a scattered resource base which makes a few companies perform extremely well while others are performing badly. This supports the argument presented by Collis & Montgomery who state “a company’s resources drive its performance in a dynamic competitive environment” (Collis & Montgomery, 1995). Thus, the companies with large resource bases are well off in the top industry which makes their performance extremely good. But some companies do not have access to these resources which decreases their market capitalization, which measures the size of the bubble and thus makes their performance so bad. Whereas in bad performing industries the companies have resources closely placed, which decreases the strength of the top-performing companies. So companies at the top have similar market capitalization and thus perform almost equally in the short and the long run. Thus they perform well even when they are in a bad performing industry.
Conclusion
In general, when companies are in the same industry it is the intrinsic quality of the company that makes the difference in their performance. Companies that have been performing well in a bad performing industry must be well placed in terms of their proximity to resources like raw material or technology which makes their performance better than the other firms. So the firm’s performance is dependent on the industry’s performance but it is not a sufficient condition to demonstrate the firm’s performance. Further, as Porter said it is not the operational efficiency alone that can improve the firm’s performance, it is the concentration of the firm in its core competencies that improves its performance (Porter, 1996). This argument has been supported by others who believe it is the resources that help the firm perform better (Collis & Montgomery, 1995). Thus, industry performance is a necessary condition for the firm to perform well but not a sufficient condition.
Reference
Collis, D., & Montgomery, C. (1995). Competing on resources: Strategy in the 1990s. Harvard Business Review, 73(4).
Morningstar. (2009). Stocks. Web.
Porter, M. (1996). What is Strategy? Harvard Business Review, 74(6) , 62-79.