Abstract
In the following paper, we will conduct a microeconomic analysis of Nike, a company specializing in the production of sports footwear. The available data indicates a visible trend towards a steady increase in both the costs of production and revenues over several years. Considering the identified performance indicators and the dominant position of the company on the market, we conclude on the suitability of the strategies chosen by the company and recommend further investment in the decrease of production costs in the developing countries which, in our opinion, present the biggest capacity for improving profitability.
Nike: Economics of an Empire
In the following paper, we will conduct a microeconomic analysis of Nike, a company specializing in the production of sports footwear. We will assess the variables of demand and supply relevant for the company’s operations, analyze price elasticity demand and its implications, identify variable and fixed costs and their impact on pricing decisions, and the conditions of the market as well as Nike’s share in it. Based on the obtained data, we will suggest a range of recommendations on the company’s future actions which present the best opportunities for its development. The analysis will be performed based on the available data and backed by the information derived from the management’s discussion.
History of Nike, Inc.
Nike was started with the ambition and passion of two men, Bill Bowerman and Phil Knight. The former was a coach at the University of Oregon, where he met with Knight, who was an avid athlete. They soon found common ground in their interest in developing high-quality running footwear which could at the same time be a profitable venture. The idea materialized in 1963 when Knight managed to make a deal with Tiger, a Japanese shoemaking company, for the first order of shoes, then sold under Blue Ribbon Sports brand name. In the first year of operations, the success became so apparent that the co-founders had to hire a full-time salesman and, by 1971, the Nike brand name and an iconic logo were born (O’Reilly, 2014).
From then on, the company experienced a steep upward climb in profits and recognition. Nike’s staggering success is sometimes viewed as a result of successful reframing of the sports activities from the useful and engaging pastime to the way of manifesting a lifestyle (O’Reilly, 2014). This approach inevitably reflected on the company’s product line. Nike’s central products remain within a clearly sport-oriented domain and include clothing and footwear for running, basketball, football, men’s training, women’s training, and golf (Nike, 2016). However, it notably includes goods which are sports-inspired and used primarily to associate with a certain lifestyle (O’Reilly, 2014). In addition to clothing and shoes, the product lines include sports apparel, the development of which exhibits the same approach, and a range of equipment and accessories, such as watches, eyewear, gloves, socks, bags, sports balls, and digital devices, among others (Nike, 2016). While made with the same attention to quality and innovation, some of the products clearly fall within the lifestyle rather than the performance category.
Supply and Demand Conditions
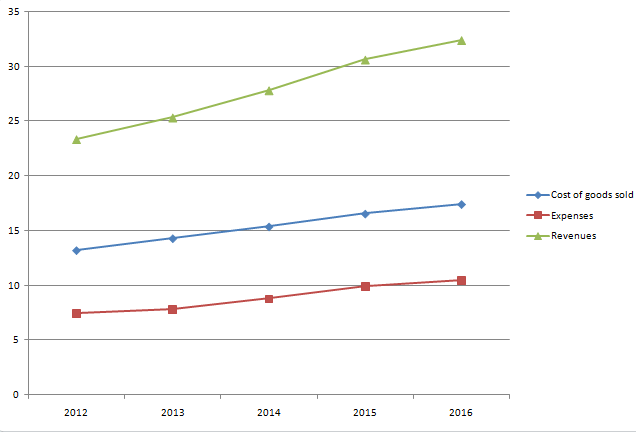
The revenues of Nike for the last five years have been steadily rising, with an approximate increase in 2 to 3 million dollars each financial year. The latest the financial year of 2016 resulted in revenues of $32 million (Nike, 2016). Such a trend of steady and predictable upward growth aligns well with the stated goal of the management’s operations of achieving long-term, sustainable revenue growth. Therefore, while there are no evident reasons which can be conclusively tied to such a trend, we can assume that the chosen strategies in key areas, such as the expansion of gross margin and optimization of selling and administrative expenses are at least partially successful in reaching the said goal. In addition, it is possible to speculate that the current interest in Nike’s products is increasing, which strengthens their financial success.
The major share of customers is young and middle-aged people who are interested in sports and actively associate with the sports community. For them, both the actual sports and the manifestation of their lifestyle are relevant. The change of several variables can alternate the demand for the company’s goods. First, the rise in income among Nike’s intended audience will most likely lead to an increase in demand. Since all of the products are strongly associated with high quality and unique characteristics, they can be safely considered normal goods, which means that with the improvement of the customers’ financial capacity they would buy more hi-end sportswear as well as thematic accessories and equipment.
The change in the price of related goods, more specifically, the rise of the prices for sportswear offered by the competing firms, will inevitably increase the demand for Nike’s products since these two groups of goods are substitutes. However, if the vendors operating fitness rooms and gyms decide to raise their fees, the demand for sports accessories, clothing, and equipment is expected to decline, as the former are complements and therefore are expected to impact the demand of each other. Finally, the expected future prices is a significant determinant of the demand for Nike’s products. Most of the goods offered by Nike are seasonal, which means that some of them are eventually sold at a discount price. In addition, the sportswear is visibly influenced by fashion trends, which further increases the chances of price drops in the future. This may lead to the decline of demand as more customers stop buying the goods in the hope of obtaining them later at lower prices.

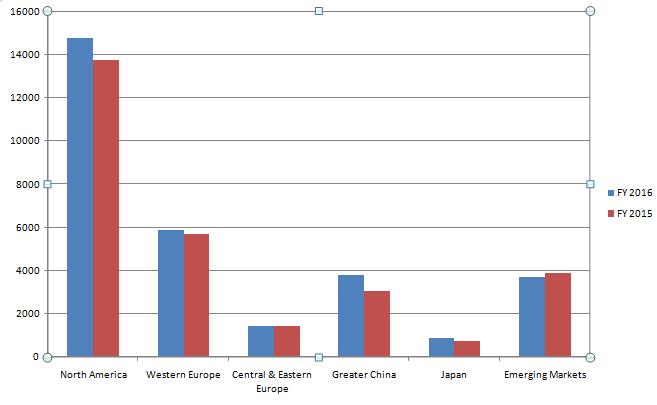
As can be seen from the chart, revenues are highest in North America and Central Europe, with China and the emerging markets following close by. Such a breakdown of revenues creates a possibility of change in supply based on the change of input costs. Specifically, most of the footwear, clothing, and apparel is made from synthetic materials, some of which are known for their controversial environmental effect. Therefore, a scenario is possible where the tightening regulations of synthetic material production will lead to the increased costs of raw materials supply and, in turn, the decrease of supply of goods. On the other hand, these materials are heavily dependent on the technology of production. This opens up the possibility of improving (and cheapening) the production process, which is a technological change variable and will lead to a better supply of goods.
Price Elasticity of Demand
Price elasticity of demand is used to determine the responsiveness of the required quantity to the changes in the price of goods. To avoid ambiguity related to units of measurement, it is calculated using the percentage values by dividing the change in quantity demanded by the change in price. Therefore, price elasticity formula is as follows:

If greater than one (in absolute value), the result of the calculation indicates that the price is elastic. This means that the price of the product is sensitive enough to generate a decrease in demand which exceeds (in percentage) the increase in the price of the respective magnitude. If the price elasticity of demand is lower than one (in absolute value), the price is considered inelastic, which means that the increase in price does not lead to significant changes in demanded quantity. If the value is zero, the change in price generates no change at all.
Since Nike’s annual report does not include exact data of price changes, we cannot calculate the elasticity directly. However, the report mentions the increase in revenues resulting from an insignificant increase in the average selling price of their footwear (Nike, 2016). Since the direct relation between prices and revenues is characteristic for inelastic products, we may conclude that the pricing policy reflects the management’s knowledge about the inelasticity of their primary product.
Consumer Responsiveness
There are several determinants which shape the price elasticity of demand for Nike’s products. For instance, the availability of substitutes increases the elasticity, since the consumers can switch to the products offered by the competing companies (e.g. Adidas and Reebok). With the passage of time, it is also likely that the consumers will find ways of changing their buying habits, further increasing elasticity over time. Next, if a product is not a necessity, the elasticity is expected to be high.
The determinants which are most likely responsible for the inelasticity determined above are the share of goods in the consumer’s budget and the definition of the market. First, while it can be argued that the company’s products are a luxury as they are not required for daily routines, the perception shared by the majority of the population (mostly resulting from the efforts of the company) places sports activity among the contemporary needs. Therefore, the products are broadly defined in the market, adding to inelasticity. Next, the average price of sports footwear is below $100, which constitutes a relatively small share of the average consumer’s budget. Thus, these determinants are likely responsible for the resulting inelasticity of the product.
Pricing Decisions
Since the price elasticity of demand determines the relation between the chosen prices and revenues, it affects the company’s pricing decision. For instance, if the price elasticity of the product is low, the company will be reluctant to decrease prices, since it will result in an insufficient increase in sales and a relative decrease in revenues. On the other hand, the company dealing with elastic products will refrain from increasing prices since it can decrease demand substantially.
In the case of Nike, the company shows some capacity for price increase due to the inelasticity of its footwear price. However, the presence of determinants that traditionally contribute to elasticity (e.g. availability of substitutes) suggests that this capacity is limited. Therefore, only a minor increase is recommended.
Costs of Production

As can be seen from the graph, the company displays a trend of consistent increase in both the cost of goods sold and the operating expenses. The former can be explained by several factors. First, the recent orientation of the company towards more ethical production conditions require significant investment in the labor market, especially in developing countries (Nike, 2016). Second, the recent considerations connected to sustainable production and gradually strengthening environmental regulations demand investment in the respective sectors. Finally, the shift towards automatization of routine labor requires updating the existing equipment and other inventory associated with innovation. The latter can be traced to the close attention the company pays to marketing and advertising. In addition, the improvement of working conditions in factories from developing countries is commonly associated with increased salaries and insurance expenses.
In addition, there is a clear correlation between the operating expenses, cost of goods sold, and revenue. In other words, with a steady annual increase in expenses, we can observe a respective increase in revenues. Such a pattern is characteristic for industries where the majority of costs associated with production are variable costs, i.e. related to the output of the company. Since for Nike most of the revenues depend on the number of goods sold, the materials, labor, and infrastructural updates are expected to rise accordingly.
However, it is worth pointing out that the graph also illustrates a steeper growth of revenues compared to costs. In other words, the company experiences an increase in gross profit. This shows the benefits of the strategies chosen by the company. For instance, the increased expenses associated with the development of innovative materials lead to the decreasing costs of raw materials.
Output Decisions
The types of categories of costs listed in the income statements are the costs of materials, salaries, insurance, cost of inventory, and property and equipment. Of these categories, only the first is generally considered variable while the rest are usually fixed, although it depends on the industry and certain particularities.
In the case of Nike, the salaries of its workers are currently reorganized to meet the ethical considerations. In addition, some of the salaries may vary depending on the company’s performance. This categorizes them as variable costs. Next, both the cost of raw materials and the expenses associated with research and development is variable since they alter depending on the amount obtained.
On the other hand, insurance is fixed costs. Although also can be adjusted, such occurrences are rare and irregular. The same can be said about the equipment and property. Despite being subject to modification and update, the associated expenses are usually restricted to maintenance. The presence of fixed introduces one significant disadvantage: under unfavorable conditions, it does not allow to adjust losses by decreasing performance. The variable costs, on the other hand, inevitably influence gross profit in the case of increased performance. For Nike, the former is less significant due to an obvious steady increase in profitability, which means that it will increase its production level.
Overall Market
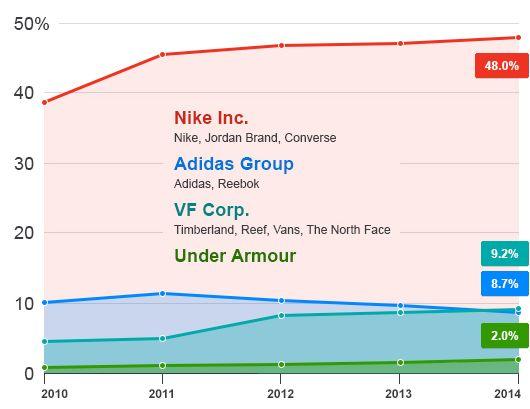
According to the research by the Sporting Goods Intelligence, the market share of Nike has steadily risen in the market of footwear for five consecutive years, increasing from under 40% in 2010 to 48% in 2014 (Roberts & Kasudia, 2015). Three of its largest competitors – Adidas Group, VF Corp, and Under Armour, occupied a significantly smaller share of 9.2, 8.7, and 2%, respectively, with a share of Adidas showing a trend of steady decline since 2011 (Roberts & Kasudia, 2015).

Barriers to Entry
Barriers to entry are factors which limit the possibility of new competitors to enter the existing market. Three types of barriers are economies of scale (the dependence of a firm’s profitability on the time it is operational), ownership of key input (the control of specific resource crucial for production), and government-imposed barriers (regulations and laws which are challenging for the entrants). The second barrier clearly does not apply to the footwear industry as their production does not require any limited or specific resources. The third barrier is also insignificant since such regulations are non-existent. However, the economies of scale play a major role. While the production of shoes does not require large investments, the recognition of a brand depends in large part on the innovation and research behind the products, as well as a significant marketing effort. Thus, new entrants have little chance of occupying the dominant market share in the short run.
Market Structure
The market structure that applies best to Nike is an oligopoly. There are several pieces of evidence which support it. First, the market is dominated by a few firms (four). The four-firm concentration ratio is 67.9%, which aligns with the criteria. Next, the ease of entry is low. Finally, the product type is differentiated with several exceptions, where it is the same. Since Nike’s share is dramatically bigger than any of its closest competitors, and there are reasons to believe that this setting will persist, the company has tremendous ability to dominate the market and determine its further development.
Recommendation
Future Production
The displayed trends of a steady increase in both costs and gross profit suggest that the current strategy of decreasing costs through research and infrastructure update is sustainable and is to be maintained. The emphasis should be made on the developing countries, which now serve as a basis for the majority of the country’s operations and at the same time have the most issues of efficiency. Therefore, they present the largest space for improvement and innovation and hold the biggest capacity for profit. Simultaneously, the introduction of automated processes into production eliminates routine tasks and decreases the costs of production, which is relevant for developed countries.
Position within the Market
The firm’s dominant position in the market will increase the chances of the success of the suggested directions. First, most of the innovations and structural updates require significant investment, which would be challenging for smaller companies. Nike’s significant resource base, as well as its long-standing presence on the market, increases the chances of successful intervention. In addition, brand recognition will contribute to the reputation of the company once these changes yield benefits. For example, the improvements in infrastructure in developing countries will improve their overall well-being and can draw in investment.
Success Sustainability
Since the price of the goods is inelastic, the company has an opportunity to regulate profits by adjusting the prices of its goods. A large amount of goods sold allows even a minor alteration to lead to a significant rise in profit, which was proven a successful strategy in the past. However, it should be noted that the reported inelasticity can only be relevant for the established markets where the marketing is adjusted to the values and cultural specificities. Therefore, upon expanding to the new markets the company is recommended to assume higher elasticity (generally characteristic for the clothing and footwear). Therefore, to improve sustainability, Nike should implement culturally-adjusted marketing policies to create a broad differentiation of the market similar to the established North American and European markets.
References
Nike. (2016). Form 10-K. Web.
O’Reilly, L. (2014). History of Nike. Web.
Roberts, D., & Kasudia, A. (2015).This chart shows how far Adidas has fallen in footwear. Web.