Introduction and Background
Nuclear systems present a wide scope of radiations drawn from various particle and rays present within the system. To this end, it is highly probable that such particles as alpha, beta and neutrons together with gamma rays are always present in a given nuclear system. While most of these particles lose their energies owing to nuclear interactions and individual scattering events, gamma rays are relatively different. Comparatively, these rays penetrate matter with ease and, on impact they interact with matter through Compton scattering, photoelectric effect and pair production. Vitally, once they penetrate matter it is apparent that the intensity of the rays decreases. As such, this drives us to ponder how both the absorber and the rays correlate.
Basically, since an absorber affects the intensity of the exiting rays then it follows that the magnitude of a ray is a function of the absorber thickness. Consequently, this can be represented as below mathematically:
I = I0·eµx (Lehmann 34) (1)
Where; I, I0, µ and x represent the intensities after and before interaction, the attenuation coefficient and the absorber thickness respectively. This can be simplified by the introduction of natural logs to:
Ln (I/I0) = -µx (2)
When the quotient of this ratio results to 0.5 then the thickness responsible for this is referred to as the half value thickness (x).
Description of Experimental Setup
The setup in this experiment is as shown below:

List of Equipment Used
The below is a list of all the raw material and equipment used:
Source (Radium 750-1000 No Chiclig), Absorber (Aluminum sheets 2.5 cm thick), detector (6B *Gas filled * 12-4-97).
Procedure
The equipment was arranged as is in figure 1 above and hence ready for analyses. The detector was then turned on prior to the commencement of the experiment, the rational being to record the background counts vital in eliminating experimental errors due to background sources. The source was then placed at a distance of approximately 3 cm from the detector and, prior to placing an absorber, the detector reading was given a moment to stabilize. This was then followed by placing an absorber between the sources and the detector before a gross count reading was taken and recorded. While maintaining the same position, sheets of aluminum were added momentarily while taking the detector readings until the readings were 25% that of the initial reading. The results were then plotted on a semi-log paper for analysis.
Similarly, while maintaining a similar position to that of the aluminum plate, a wooden absorber 1 cm thick underwent the same procedure and, later, the results were compared.
Data
Table 1: showing natural log of the original intensity I0 and the thickness (x) of the absorber (Aluminum).
Table 2: showing natural log of the original intensity I0 and, the thickness (x) of the absorber (Wood).
Analysis of Data
The raw data was manipulated using the formula below (3) after the introduction of natural logarithm on either side of equation (1). The intensity of radiation is a function of the thickness x of the absorber hence the equation;
I = I0·eµx (Lehmann 34) (3)
Introducing natural logs:
Ln I – LnI0 = µx (4)
Rearranging:
Ln I0 = -µx + Ln I (5)
As such, the gradient m = -µ and, the y-intercept = Ln I.
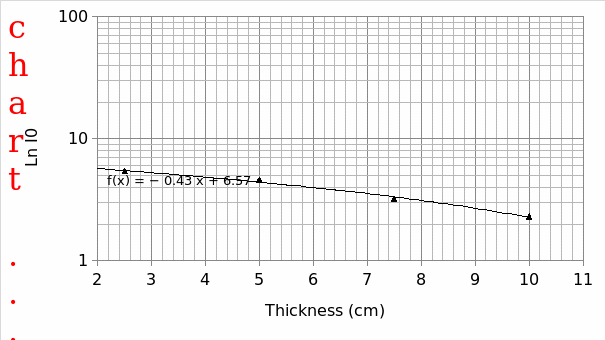
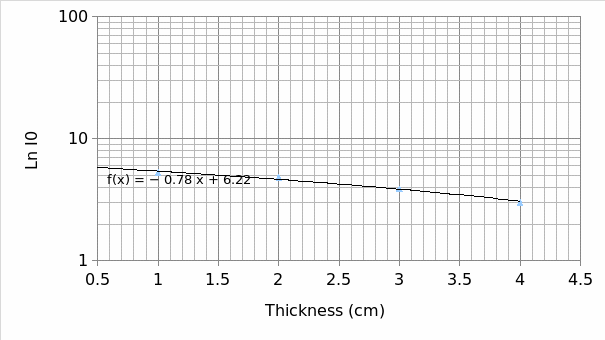
From the graph the background count was found to be 25 cpm and, the half value thicknesses was calculated courtesy of the information obtained from the plots i.e. the values of the attenuation coefficient µ. For the aluminum and wood these values were found to be 1.6 1 and 0.89 centimeters respectively. To obtain the half-thickness for aluminum the below formula is applied:
x1/2 = 0.693/µ
But; the attenuation coefficient of Aluminum µAl = mAl = -0.43

As portrayed by the linear equations, the values for the gradients otherwise µ for both the aluminum and wood are -0.43 and -0.78 respectively.


Discussion of Results
The objective of this experiment was to investigate the shielding effect of different materials. This was achieved using a gas-filled detector. From the analyses done it is evident that the half value thicknesses for both aluminum and wood were 1.61 and 0.89 cm respectively. In order to obtain this, it was necessary to extrapolate the graph beyond the count rate data to establish the original intensity of the two. However, with Excel, you can get this from the formula. In this case, when comparing the two, a 1 cm thick, wooden plate is a better shielding material than a 2.5 cm thick, Aluminum plate.
As portrayed by the linear equations, the values for the gradients otherwise the µ for both aluminum and the wooden plates are 0.43 and 0.78 respectively. As such, as opposed to the wooden plate, gamma rays easily penetrate the aluminum plate.
To improve on the accuracy of the results then future experiments need to be performed in an enclosed environment and, concurrently rather than subsequently.
Conclusions
The objective of the experiment was met and hence; it was established that a 1 cm thick, wooden plate is a better shielding material than a 2.5 cm thick, Aluminum plate.
Reference
Lehmann, Walter. Atomic and Molecular Structure: the development of our concepts, San Francisco: W.H. Freeman & Co., 1972. Print.