Literature Review
Crushability of a structure is the likelihood that the structure will crash, whether it is a vehicle, building, bridge, or antenna masts. In designing structures, which can withstand a crashes, a lot of emphases has to be applied because it is vital in preventing and reducing the rate of recurrence of death and fatality accident (Smith 2001). Many scholars have taken their time investigating the aspect of crushability of some structures, as well as the capacity of absorption of various structures. They have taken intensive studies of the thin-walled structures including tubes, stiffeners, and shells (Smith 2003). Through their studies, they have discovered that these structures are very efficient impact energy absorbers. The studies explain the geometrical shape of a structure of deformation in energy absorbers and give accounts for their various geometrical shapes.
The studies further explain the method of crash, the strain hardening and strain rate effect. There exist several approaches for determining the absorption of energy for structures. One of the approaches is by using what is known as the finite element analysis. The second approach is that of experimental analysis. The third approach is the use of theoretical analysis or conceptual analysis (Smith 2002). Using the finite element analysis is highly exorbitant coastwise and consumes a lot of time. The same case applies to Experimental analysis. To that effect, the best choice of an approach is the theoretical or the conceptual analysis of collapse mechanism (Smith 2002).
Choice of Model
The choice of approach is done in the preliminary stages of structural design of shapes. Theoretical method is a simple approach for predicting the crash behavior and energy absorption of a structures and shapes. For example, circular pipes have found wide application in Engineering and construction as structural members. This has provided enough exposure of circular tubes to studies of its collapse behavior, with a special interest on its energy absorption. To do a forecast the crash reactions of structural materials, a scholar needs to use the finite element analysis or the experimental analysis for obtain more perfect outcomes.
However, they have to prepare in advance and allocate fun to cover the costs. The most appropriate model in the early design phases is the approximating model of tubes crash mechanism (Arduini and Nanni 1997). This study aims to design a closed-form solution as the optimal design of thin-walled circular tube, which can withstand a lot of energy when subjected to bending forces. It takes into account, the rate of energy absorption of circular structures such as hinges in the circular direction. The three dimensional geometrical crash mechanisms were evaluated by placing an additional slanted hinge lines along the longitudinal cross-section of tube in the length of elastically bending area. The model was developed in the consideration of energy rate conservation. It therefore implies that, the rates of internal energy absorption were computed for each hinge line.
Geometrical Model
To determine the desired structural properties of loads, the first step is the analysis of the requirements related to the strength, displacements, cyclic life and the weight. Apart from the strength, the design shape and size is often determined by maximum displacement. The requirements of service life are essential in determining design. Therefore, they have to be well defined in every step of stress analysis.Take a simply beam supported at both ends from the bottom with a length of 2L. The plate bounded by the beam also has a length of 2l. A longitudinal force N0 pulls the beam at both ends marked of the beam. It also experiences a pair of end moments M0 and a transverse load marked as T(x).
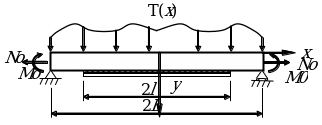
This analysis assumes that the only existing forces are the cross-sectional shear stress and strain in the beam. It does not take into account the existence of the cross-sectional normal stress in the beam and the plate. It also assumes that each layer in the arrangement is elastic and of uniform strength. Specific energy absorption equations SEA is expressed in the form of SEA= Em (do / Pcm Ge), where Do is the maximum normal stress, Gm is the natural gravitational force (10N). Em is the compacting strain and Pcm is the density of the material used. In this case we construct a cylindrical shape, hence calculations of energy absorption using analytical equations. The relationship between Do and Pcm is very vital in this computation of energy absorption for crushable materials. The main aim of this computation is to determine the density of the material hence the size of bending angles required. In this case Energy absorbed (SEA) = 7500 Joules, length is 375mm. What we want to calculate is the Pcm.
SEA =Em (Do/Pcm*Ge)
7500=40(355/Pcm*10)
Pcm= (40*355)/7500
Pcm= 1.893Kg/mm3
The density of the envelope is 1.893Kg/mm3.
Strain-rate Sensitivity
The index m for measuring strain-rate sensitivity, is usually determined by drawing the elements of stress against the strain. The resultant graph gives a constant known as the strain rates. The curves in normal conditions show an S shapes. The second method of determining strain rate is known as the multi-strain rate jump test (Aprile and Limkatanyu 2001). This procedure involved application of increase and reduction of m by 20 percent for every100 percent rise in the material length. Multi-strain test enables an engineer to examine the strain rate behavior whenever values of strain of material changes. The data are represented on curves, which demonstrate bell-shape curvature that are characteristically super plastic materials. Strain rate is directly proportional to strain.
Stress and strain Relationship
This research first defines stress and strain, and then it provides the relationship between the two in relation to the elastic region. The correlation between stress and strain uses axial stress and strain cases. Normal stress is the stress, which an object encounters when a force is applied along its longitudinal axis. It is also called axial stress. It is represented by the equation P=F/A where F if the axial stress and A is the cross-sectional area.

The standard unit for measuring stress is Newton per Square Metre or Pascal (Pa). Normal strain is calculated as the ratio of displacement to the initial size of the object or the deformed material. Normal strain is represented with the equation E= (L1-L2)/L1.Strain is therefore unit-less, because it is a ratio of lengths. Shear stress is a pair of forces that tends to deform an object at the moving point. It applies in cases where a purely sheer force is exerted on a structure. The formula for obtaining shear stress is similar to the formula for tensile stress. Likewise to the standard units remains the same as those of tensile stress.
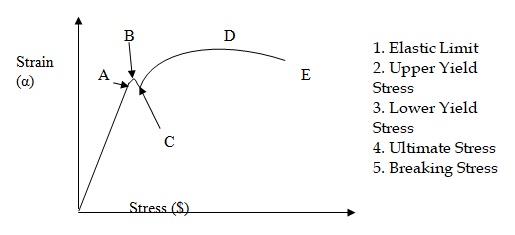
The dependence that exists between the two forces of stress and strain is represented in figure 3.
Modeling and loading
The properties of materials, modeling abilities and the loading capabilities are essential tools in calculating structural behavioral characteristics of the object materials, for example, its displacement and stress distribution as related to relevant anticipated forces. It is vital to determine whether a structure is linear or non-linear to predict how it will behave when subjected to external load In the case of a linear structural; its behavior is directly influenced by the external force of the load. In this case, the principle of superposition is applied, which states that the reaction in response to many loads applied is the same as the sum of loads. On the other hand, for a non-linear structure, the behavior is dependent on other physical properties such as the volume, strength and shape. The same experiment and calculation has to be repeated for different amounts of forces (Lu et al 2005).
Performing calculation using linear the linear equilibrium equation is a rather complicated process but guarantees accurate results for various geometrical shapes. Examples of physical properties of structures, which play vital roles here, are elasticity, shear stress and pressure vessels. Using static loads in the stress analysis reveals the anticipated impacts of the real forces the structural object is bound to withstand (Rahimi and Hutchinson 2001). The theoretical design phase of stress analysis allows verification of such impacts and in terms of their validity. Here, validity means they fall within the acceptable range of loads.
Stress and Strain Profile
Let α denote elements of stress tensor, which is refers to a set of a three dimensional Cartesian coordinate, with axes Yl, Y2, and Y3. The equations of equilibrium position are represented as :(dαij/dyj)+Fi=P(d2ui/dt2),
Where αij= αji, and Fi is the force per unit volume of the body, ui the displacement of the motion, and p the mass density of the body. The element Ti of the pressure (force per unit area) acting on a plane with normal (ni) is represented as Ti= αijnj
Strain $ij and rotation Rij elements are defined using displacement gradients by the model: $ij=1/2((dui/dyj) + (Duj/Dyi)) and Rij= 1/2((dui/dyj) – (Duj/Dyi))
In the cases of finite deformation, other appropriate measures apply, using a model: ((D2$ij/DykDyl) + (D2$kl/DyiDyj)) = ((D2$ik/DyjDyl) + (D2$jl/DyiDyk))
These are referred to as compatibility equations and they prove that a strain fields are derived from displacements. However, strain and stress have a different constant of proportionality (Ahmed et al 2001). This report first gives the definition of stress-strain relationship, and then it describes their relationship in terms of elastic region and plastic region. The correlation between stress and strain is reinforced by uni-axial and bi-axial cases. For ductile materials, an equation for the curve is r=F/A0, which is simplified as r=Gy, where G is a constant called the shear modulus. It creates the relationship between the shear stress and the strain existing in the elastic region. In the cases of linear and isotropic materials, the constants E and G are connected through the formula: G = E/ (2 (1+v).
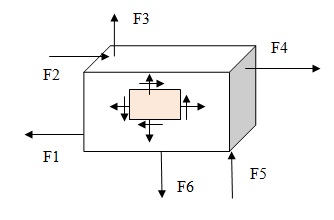
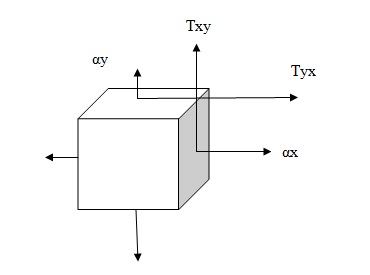
In the linear isotropic material, the plane stress state makes assumption that αz=Rxz = Ryx = 0, and Yxz=Yyz=0.
State of plane stress appears in a thin metal plate, which is subjected to various forces acting in the center of the plane of the plate. Plane stress state is evenly distributed, reaching out to the surface of an object or a machine. Essentially, it occurs anywhere on the surface of the object free from external load.
Occurrence of Fracture and Deformation
Deformation and fracture takes place on a material when a force is applied on it beyond its elasticity. The concept of elasticity does not take into consideration the aspect of plastic deformation or fracture. This is because the general assumption is that the reactions of the plate conform to the conditions satisfying the elastic limit. It is therefore vital to determine if the elastic limit of the plate is exceeded through induced stress or deformation. This is done by a laboratory experimental method known as the appropriate verification and validation distribution in the whole structure. Alternatively, appropriate verification and validation can be carried out against finite element simulation and modeling, done through customized software (Hibbeler 2005). In a study of mechanism of fracture and deformation of a super alloy of wrought nickel at high temperature, investigations were done under isothermal cyclic creep and creep condition. The study revealed that the creep-fatigue interaction, which was characterised by the tensile hold duration and introduced to the creep stress, exhibited no significant impact in creep life regardless of the durations of holds used (Teng et al 2002). It also revealed that by introducing the tensile hold duration, it led to decline in the count of cycles to failure and a corresponding increase in the hold duration. The experiment showed a decrease in the strain rate at the isothermal cyclic creep. The more conspicuous decrease in the strain rate is only attributed to the participation of a more active fatigue in the process of fracture and deformation (Chen and Teng 2001).
Activation Energy
Another vital factor involved is the activation energy for the super plastic deformation and fracture, denoted by letter Q. This was determined by assuming that the strain rate sensitivity follows a Type of dependence for absolute temperatures $.exp(Q/R.T)=Aαn where letter A represents the material constant, G represents the gas constant while letter n represents the stress exponent, expressed as n = 1/m. To calculate the activation energy under a constant strain rate $, we use the following formula:
Lnα= (ln$-lnA)/n +1/T*Q/R*n
The activation energy A is obtained by the gradient of the line plotted with lnα against. 1/T is Q/(R * n). In this experiment, the alloy is found to act at an activation energy calculated using the principal strain rate of 7.49*(10–4 /s) and a true strain $ = 0.5
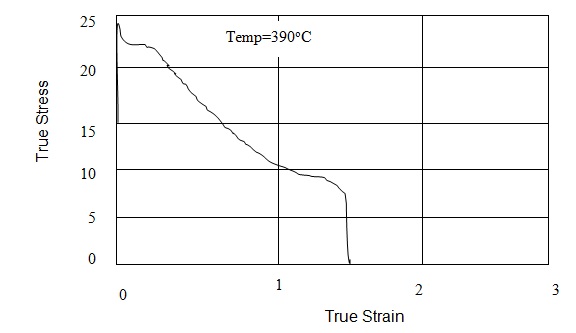
Figure 6 shows the plotted curve with an initial strain rate 7.5 * 10–4/ s for temperatures between 390 °C and 500 °C. The flow curve stresses during true strain 0.5 and at various ranges of temperatures. Taking the strain-rate sensitivity index m to be 0.46 over the range of temperature between 390 and 550°C, the mean activation energy Q for any given test condition is: Q = k * R/m. In this case Q=8420.069*8.3140/0.46. The calculation obtains approximate value of activation energy as 151.87kJmol-1.
Fracture mechanisms
Investigation of structure along the plane adjacent to the crack initiation reveals that the crack initiation takes place more at the grain boundary intersections with the specimen surface no matter the duration of hold time. Secondary cracks appear to dominate the grains boundaries perpendicular to the applied stress (Rice 1968). All the fractures occurred at either the creep or cyclic-creep having long hold durations with inter-granular fracture initiation and propagation mode. Based on fracture mechanism examination at the destruction process, regardless of the hold time, the leading role of inter-granular breakage was evident. This is a proof that the determinant factor to fracture and deformation is the creep (Nairn 2000). From the study of inter-granular fractures, its analysis revealed that fatigue mechanisms contributed in the destruction process when a shorter hold time of 30 was applied to low cycle fatigue. In these scenarios, there existed the intra-granular fractures and initiation of fatigue. In the higher stages of cracks, the fractures were propagated by inter-granular mechanisms. The impacts of fatigue became more pronounced with the decrease in hold time. After the opening of critical crack, further propagation of the fracture was that of mixed breakage form and inter-granular cleavage.
Behavior of stress/strain through lobe or ribbon formation
Practically, the true stress and true strain usually find application in mechanics. Lateral strains and axial strains are related in ratio known as the Poisson’s ratio that is the ratio of the lateral strain to axial strains (Ascione and Feo 2000). The ratio is expressed in the form V= -$x/$z = $y/$x. In theory, the maximum value of Poisons ratio is 0.5. Most metals have the value between 0.23 and 0.38. Take an example of a uniform ribbon of length l, width w and height h. Its volume V is obtained by V=l*w*h
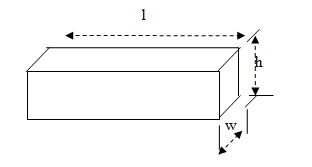
V=l*w*h
δV = δl wh + δw lh + δh lw
δV /V = (δl / l) + (δw / w) + (δh / h)
This implies that the volumetric strain of a fractured body is the sum of its linear strains in each of three mutually perpendicular directions of the height, length and width.
ev = (ex +ey +ez)
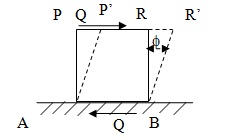
The strain, which goes with a shearing action, is referred to as shear strain. An object is permanently distorted by applying external forces or share forces at the angle. It is measured in the units of radian. Shear strain is denoted by symbol Φ. Take an example of a cube shape ABRP in figure 7. Two forces Q are applied on it at the bottom and top. These two forces called sharing forces are equal and opposite. The two forces are AB and RP. If the lower surface is made into a fixed base, the cube will experiences distortion through angle Φ to assume the newly acquired shape ABR’P’. Now the shear strain or distortion (deformation) per unit length is calculated as:
Shear strain of the cube = RR’ / RP = RR’ / BR = Φ radian
Elasticity and Elastic Limit
Elasticity of an object is the property of the object, which enables the object to, regains its original shape and size when the force causing deformation is withdrawn (Teng et al 2002). Majority of materials are elastic in nature but their elasticity is of a lesser value. Perfectly elastic materials are rare to find in nature. Elastic limit is defined as the maximum stresses to which a material can obey behave with the property of elasticity. If the elastic limit of an object is exceeded then the object will be permanently deformed by the force. The object will not be able to assume its initial shape and size at the removal of the force, so the result will be a permanent deformation. The object is said to have undergone residual strain. When an object is subjected to weight beyond its elastic limit then the stress increases to a point at which the object begins to yield (Täljsten 1997). This stress is known as yield stress. The study of Physical properties and behavior of various materials are founded on the relationship between strain and stress and on a common law called Hooke’s law, which states that stress is directly proportional to strain for as long as elastic limit is not exceeded. If S is the stress induced in an object and e the strain corresponding to S, then for Hooke’s Law to be satisfied,
S / e = E. E is a constant known as the Young’s modulus or the modulus of elasticity.
How Fracture and Deformation Relates to other Characteristics of Materials
The deformation and fracture models are useful in predetermining relationships that exist between fracture toughness and other physical properties as yield stress, strain hardening exponent and ultimate strength. Other characteristics include uniform elongation and the reduction of area deformation and cracking. As it has already been seen that that a does not change due to changes in the structure of the material, a number of experimental evidences were found to validate the formula which relates the fracture properties to other characteristics (Chaallal et al 1998). The experiments performed on a carbon steel and on a martensitic steel confirmed the relation equation K = Aa. In the following equation KIC = A20y it follows that the analysis of other fracture models indicate the existence of fracture toughness and its relation to other mechanical properties.
In many practical situations, the relationships shown above can be obtained for approximate values of the anticipated fracture toughness of the material from its mechanical properties and for the examination of the assumed fracture toughness of new materials, which are developed without conducting the deforming and expensive fracture toughness tests.
Conclusion
In conclusion, the two ideas of brittle fissure of the engineering materials are based on the fracture mechanisms, the Decohesion mechanism and coalescence mechanism. Decohesion mechanism reflects the heart of fracture toughness for a perfect structure material. On the other hand, the coalescence mechanism reflects the minimum fracture toughness of a material of an actual structure (Rabinvich and Frostig 2000). The coalescence fracture mechanism is observed with in majority of engineering materials. It requires large amounts of fracture energy. Therefore, it is vital to do investigation for both coalescence and Decohesion fracture toughness mechanisms in order to analyze the properties of the deformation process to optimize the structure of the material. The coalescence fracture mechanism is based on model parameters, that is, characteristic distance denoted by X, and micro-cleavage stress O.
The two are directly related to the minimum fracture toughness property of the material. Fracture toughness depends on the temperature of materials as well as the loading rate (Bonacci and Maalej 2001). This is especially applicable for both steels and various ceramic objects in the brittle and ductile. The most important methods of improving fracture toughness of the engineering materials are associated with both the plasticization and the creation of structures would increase their minimum fracture toughness quality. To achieve this, it is necessary to increase two fundamental parameters of the material deformation that is the characteristic distance X and amount of cleavage stress.
References
Ahmed, O., Van Gemert, D. and Vandewalle, L. 2001. Improved model for plate-end shear of CFRP strengthened RC beams, Cement and Concrete Composites, 23, 3-19.
Aprile, A., Spacone, E. and Limkatanyu, S. 2001. Role of bond in RC beams strengthened with steel and FRP plates, Journal of Structural Engineering, ASCE, 127(12), 1445-1452.
Arduini, M. and Nanni, A. 1997. Parametric study of beams with externally bonded FRP reinforcement, ACI Structural Journal, 94(5), 493-501.
Ascione, L. and Feo, L. 2000. Modeling of composite/concrete interface of RC beams strengthened with composite laminates, Composites: Part B, 31, 535-540.
Bonacci, J.F. and Maalej, M. 2001. Behavioural trends of RC beams strengthened with externally bonded FRP, Journal of Composites for Construction, ASCE, 5(2), 102-113.
Chaallal, O., Nollet, M.J. and Perraton, D. 1998. Strengthening of reinforced concrete beams with externally bonded fiber-reinforced-plastic plates: Design guidelines for shear and flexure, Canadian Journal of Civil Engineering, 25(4), 692-704.
Chen, J.F. and Teng, J.G. 2001. Anchorage strength models for FRP and steel plates bonded to concrete, Journal of Structural Engineering, ASCE, 127(7), 784-791.
Hibbeler, R. 2005. Mechanics of Materials, Seventh Edition in SI Units, Singapore: Prentice Hall, Pearson Education Asia Pty Ltd.
Lu, X.Z., Teng, J.G., Ye, L.P and Jiang, J.J. 2005. Bond-slip models for FRP sheets/plates bonded to concrete, Engineering Structures, 27(6), 920-937.
Rabinvich, O. and Frostig, Y. 2000. Closed-form high-order analysis of RC beams strengthened with FRP strips, Journal of Composites for Construction, ASCE, 4, 65-74.
Rahimi, H. and Hutchinson A. 2001. Concrete beams strengthened with externally bonded FRP plates, Journal of Composites for Construction, ASCE, 5(1), 44-56.
Smith, S.T. and Teng, J.G. 2001. Interfacial stresses in plated beams, Engineering Structures, 23, 857-871.
Smith, S.T. and Teng, J.G. 2002. FRP-strengthened RC beams-I: Review of debonding strength models, Engineering Structures, 24(4), 385-395.
Smith, S.T. and Teng, J.G. 2002. FRP-strengthened RC beams-II: Assessment of debonding strength models, Engineering Structures, 24(4), 397-417.
Smith, S.T. and Teng, J.G. 2003. Shear-bending interaction in debonding failures of FRP-plated RC beams, Advances in Structural Engineering, 6(3), 183-199.
Täljsten, B. 1997. Strengthening of beams by plate bonding, Journal of Materials in Civil Engineering, ASCE, 9(4), 206-212.
Teng, J.G., Chen, J.F., Smith, S.T. and Lam, L. 2002. FRP strengthened RC Structures, U.K: Wiley, Chichester
Teng, J.G., Zhang, J.W. and Smith, S.T. 2002. Interfacial stress in RC beams bonded with a soffit plate: a finite element study, Construction and Building Materials, 16(1), 1-14.
Nairn, J. 2000. Analytical Fracture Mechanics Analysis of the Pull-out Test Including the Effects of Friction and Thermal Stresses, Salt Lake City, USA: Material Science & Engineering Department University of Utah.
Rice, J. 1968. Mathematical Analysis in the Mechanics of Fracture, New York: Academic Press.