Introduction
This paper is going to seek to evaluate the importance and significance of organ bath experiments and dose response curves to pharmacologists and medics in pharmacokinetics. It tries to find out and define what a great role these experiments play in this science. A classical organ bath experiment was carried out with a strip of intestinal smooth muscle, and a range of agonist drug doses were selected and added to the organ bath. The experimenter observed and recorded the muscle contraction and quantified the measurements. Latter, an antagonist X was added to the organ bath, and the dose-response relation of the agonist in the presence of this antagonist was measured. Another antagonist Y was then added after washing out antagonist X, and the dose-response relation of the agonist in the presence of this second antagonist was measured again.
Organ bath experiment and the apparatus used in the study
Organ bath (or isolated organ) experiments are pharmacological experiments that typically involve the isolation of a given tissue, such as a strip of intestinal smooth muscle. It is kept alive under controlled conditions so as to monitor the responses of the tissue upon the administration of a drug solution into an organ bath (Knights et al. 2010). A well-known example in the pharmacology sector is the guinea pig ileum smooth muscle preparation as it is pointed out by Knights et al. (2010pp.36-49). These kinds of dose response studies are useful for pharmacologists in assessing the concentration response relationships in isolated tissue responses upon its stimulation (Knights et al. 2010). The apparatus required to carry out an isolated organ that is involved in the experiment and comprises of a tissue organ bath, an isometric / isotonic transducer, an amplifier and a recording chart (Thomas 2007). The experimenter ensures that the organ bath is under a temperature-controlled condition, sufficiently oxygenated and in the right fluid medium in order to maintain the viability of the tissue long enough for adequate study (Mundy 1999). The isometric transducer is used to detect changes (i.e. force) in terms of contraction / relaxation of the muscle of the tissue after a dose of the stimulant drug is injected onto the tissue (Thomas 2007). The detected response of the tissue is increased using the amplifier and relayed on a chart for recording. According to these data, the researcher generates dose-response curves where the tissue response is graphed against the drug dosage (Thomas 2007).
An example of an agonist that causes contraction of smooth muscle and a possible antagonist that may reverse this process
Finkel et al (2008, pp.59-70) define an agonist as a drug that binds to a receptor and produces a biologic response that is similar to the one which would be produced by the receptor on the membrane of a smooth tissue. An antagonist, on the other hand, binds with the receptor and prevents it from causing activity, but it itself causes no response (Sherwood 2008). An example of an agonist that causes contraction of a smooth muscle would be the ‘Pilocarpine’ muscarinic agonist which is normally applied to cause papillary contraction in the treatment of glaucoma (Winstanley & Walley 2002). A possible antagonist that would appropriately reverse the mentioned process is ‘atropine’ which is a naturally occurring alkaloid that causes papillary dilatation as Winstanley and Walley (2002) describe.
Dose response curves
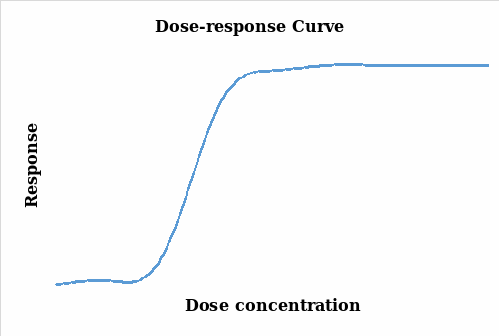
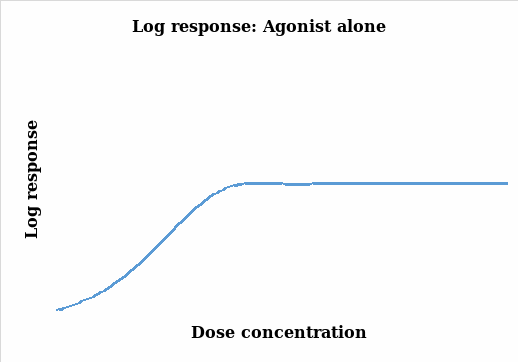
The aim of an organ bath experiment is to establish a relationship between the changes in the response (particularly contraction) and the drug stimulant (agonist). It relates the magnitude of the stimulant to the response of the organism under study (Thomas 2007). In this experiment, the muscle contraction was measured and quantified and the changes monitored under different concentrations of the agonist and the charts below were subsequently generated. Figure 1 illustrates the results without being transformed whereas figure 2 takes into account the natural log transformation of the response.


Thomas (2007, pp.29-38) points out that there is a positive correlation between response and the concentration levels as it can be seen in the two figures above. As the concentration of the agonist amplifies, the response also increases up to a maximum point where further dose additions produce no responses and the graph lags. The two plots represent a similar scenario on the effects of the agonist dose administered on the tissue with a steady response as the dose is increased. However, the log response curve presents a steeper and a more discrete representation of the results.

Reversible competitive antagonist which is an irreversible competitive antagonist
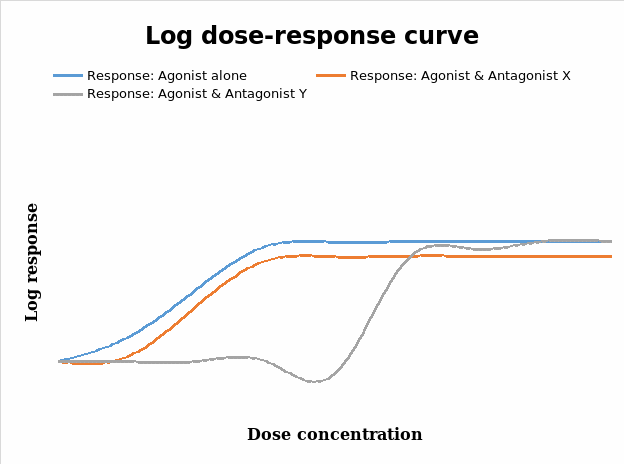
From figure 3, it is clear that the agonist alone has a greater magnitude on the response of the tissue to the different levels of the dose administered. Drug antagonists decrease the pharmacological responses to agonists and can be classified either as a reversible competitive antagonist or an irreversible competitive one (Calvey & Williams 2008). Reversible competitive antagonists combine / bind with receptors in a reversible manner, but do not induce pharmacological responses and hence do not cause changes that result in drug responses compared to the agonist. These kinds of antagonists usually displace or shift the log dose response curve to the right without altering the slope and maxima (ceiling effects) that were obtained (Calvey & Williams 2008; Thomas 2007; Golan 2008; Wilson 2000; Pinnock, Lin & Smith 2002; Tomlin 2010). From the data in figure 3 shown above, antagonist Y is the possible reversible competitive antagonist in this experiment.
In contrast, the irreversible competitive antagonists compete with agonists for receptor sites, but only slowly dissociate or do not do it at all, so the net effect that appears to be a total number of receptors available for combination with agonists is reduced (Calvey & Williams 2008; Pinnock, Lin & Smith 2002; Peck, Hill & Williams 2008). As Calvey and Williams (2008) indicate, this kind of antagonism is as a result of the strong covalent bonds that develop between the antagonist and the receptor. This kind of antagonism results in the characteristic decrease in the slope of the log dose response curve and a subsequent decrease on the maximum response produced by the agonist (Wilson 2000; Calvey & Williams 2008). This is informed by the reduction in the number of receptors that would possibly bind with the agonist to yield activity (Pinnock, Lin & Smith 2002). From this discourse, it is clear that antagonist X falls under this category in figure 3 above.
Dose ratio and its value to pharmacology
Dose ratio in the presence of a competitive antagonist is a term that describes the extent to which the log dose response curve shifts to the right. As such, it is useful in applied pharmacology to determine the factor by which the dose of the agonist is to be increased in order to achieve a maximal response in the presence of the competitive antagonist (Leslie, Jackson & Goodwin 2011). It is dependent on the concentration of the antagonist and the affinity of the antagonist receptor, but independent of agonist affinity as Pinnock, Lin & Smith (2002, pp.120-167) state.
As a matter of fact, the antagonist affinity is the inverse of the constant that defines the equilibrium of the whole drug response interaction (Pinnock, Lin & Smith 2002). Hence given data that the competitive antagonist’s concentration is 10nM, the affinity constant is computed as:
Conclusion
In conclusion, it is necessary to mention that organ bath experiments are valuable tools in the field of pharmacology and pharmacokinetics as medics endeavour to investigate the potency of various drugs on human beings. Thomas (2007, pp.104-126) defines in his work that pharmacokinetics as the ‘study of the relationships between patient response to the drug, the rate of drug metabolism on route and at the site of action, age, gender and physiological state of the patient among other factors. Since the ‘magnitude of the responses to a drug is a function of its concentration at its site of action’ (Thomas 2007), organ bath experiments are indispensable in determining the appropriate dosages for various drugs. They can apply the technique in clinical trials for drug discovery to evaluate the dosage concentrations that achieve diverse responses on the tissues and hence able to evade prescription that is potentially lethal to human beings.
References
Calvey, TN & Williams, N 2008, Principles and practice of pharmacology for anaesthetists. John Wiley & Sons: Massachusetts.
Finkel, R, Clark, MA, Champe, PC & Cubeddu, LX 2008, Pharmacology, 4th ed. Lippincott Williams & Wilkins: Philadelphia.
Golan, DE 2008, Principles of pharmacology: the pathophysiologic basis of drug therapy, 2nd ed. Lippincott Williams & Wilkins: Philadelphia.
Knights, K, Salemo, E, Knights, KM, Bryant, BJ & Bryant, B 2010, Pharmacology for health professionals, 3rd ed. Elsevier, Chatswood.
Leslie, RA, Johnson, EK & Goodwin, APL 2011, Dr Podcast scripts for the primary FRCA. Cambridge University Press: New York.
Mundy, AR 1999, Scientific basis of urology. Taylor & Francis: London.
Peck, TE, Hill, S & Williams, MA 2008, Pharmacology for anaesthesia and intensive care, 3rd ed. Cambridge University Press: New York.
Pinnock, C, Lin, T & Smith, T 2002, Fundamentals of anaesthesia, 2nd ed. Cambridge University Press: New York.
Sherwood, L 2008, Human physiology: from cells to systems, 7th ed. Cengage Learning: Belmont.
Thomas, G 2007, Medicinal chemistry, 2nd ed. John Wiley & Sons: West Sussex.
Tomlin, M 2010, Pharamacology and pharmacokinetics: a basic reader. Springer: Southampton.
Wilson, K 2000, Principles and techniques of practical biochemistry, 5th ed. Cambridge University Press: New York.
Winstanley, P, & Walley, T 2002, Medical pharmacology: a clinical core text for integrated curricula with self assessment, 2nd ed. Elsevier Health Sciences: Edinburgh.