NFL is among the most popular sports in the United States, with an ever-growing interest in the international arena. One of the key business issues in regards to the selected sport is the evaluation of player performance metrics, which is especially critical in regards to quarterbacks, who are responsible for scoring touchdowns (TDs). Therefore, there is a need for properly assessing a player’s expected touchdown rate and passing yard rate on the basis of other metrics. The given analysis will primarily focus on Passing Yards (PY) assessment and its predictive capacity in regards to touchdowns. PY can be easily measured on the basis of historical data as well as on-field training sessions, where a player’s activeness can be potentially linked to one’s touchdown rates. In other words, the core question is whether or not a players’ touchdown rates PY scores are independent variables.
The relevant data collected for the analysis is derived from the Nextgenstats website, where all NFL-related data is provided. The touchdown raw data is taken from the top 30 athletes because they are the targeted quarterbacks and give the most plausible playstyle, which is in tune with the business question. Accordingly, the PY data is also collected from the selected players, which is denoted as YDS on the website (“Passing,” 2020). The ranking is based on 2020 NFL data on touchdowns or TDs in order to make the assessment as up-to-date as possible. There are two sets of raw data; the first dataset is comprised of the top 30 TDs, which will be the observed data, and the second is comprised of PYs divided by 100. The reason for such a division is that each TD requires a player to pass 100 yards of average since the football field is 100 yards in length (Athlon Sports, 2019). Therefore, in order to adjust PY values in accordance with TDs, PY is divided by 100.
The Chi-Square Formula is X2 = Sum of (Observed – Expected)2/ Expected (“The chi square statistic,” n.d.). The bar chart for observed TDs (Blue) and PYs (Orange) are presented in Figure 1. The sum of X2 values is equal to 25.40179. The degree of freedom is equal to (2-1) * (30-1) = 29, since the sample size or N = 30 and variables = 2.

The appropriate analysis technique is Two Way Chi-Square analysis, because the question has two datasets, observed TD and PY values, which are compared if they are statistically independent variables. The analysis technique is Chi-Square Formula is X2 = Sum of (Observed – Expected)2/ Expected (“The chi square statistic,” n.d.). The derived or calculated X2 sum is used on the Chi Square Distribution table to either reject or accept the null hypothesis. The detailed calculations can be accessed Table 1.
Null Hypothesis: H0 – TD and PY are independent variables
Alternative Hypothesis: H1 – TD and PY are not independent

The inputs and outputs are presented in Table 1. Null hypothesis is that there is no statistical significance between observed (TDs) and expected (PY/100) frequencies. In Table 1, the “TD (Observed)” and “PY (Observed)” columns are raw data taken from Nextgenstats website. The “PY (Observed)” is calculated by dividing PY or passing yards values by 100, since each TD requires a player to pass on average 100 yards. For each player, Chi-Square formula was applied, where (Observed – Expected)2/Expected formula was used. The “Chi Formula” column calculates X2 value for each player by applying this formula: (“TD (Observed)” – “PY Adjusted (Expected)”)2 / (“PY Adjusted (Expected)”) = X2. The “Chi Sum” column is a sum of all “Chi Formula” values.
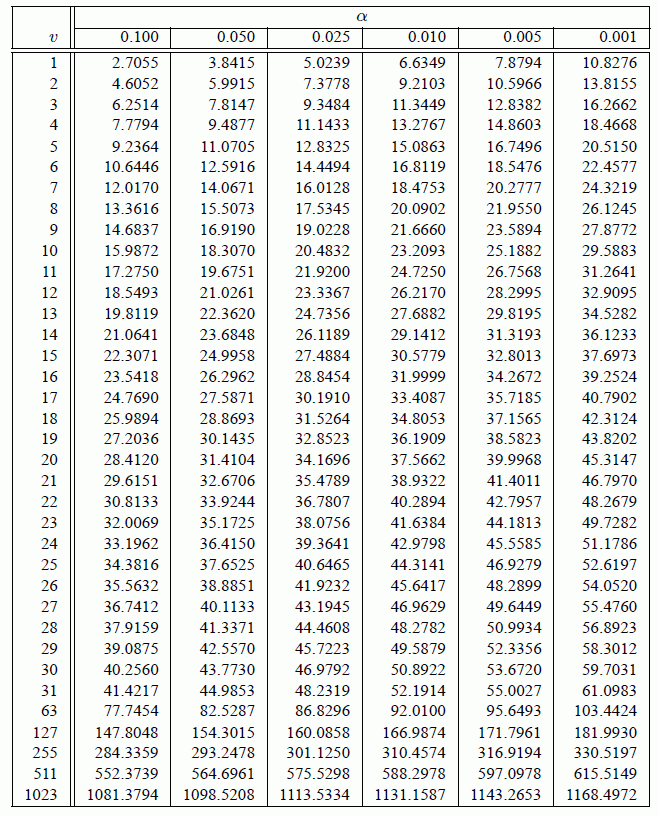
The next step involves Chi Square Distribution table, which is needed to determine whether the null hypothesis is accepted or rejected. If accepted, then it means that there is no statistical significance between PY and TD values, and if rejected, then it means that there is statistical significance between PY and TD values. Chi Square Distribution table is shown in Table 2. From the table, it is possible to determine the critical value for Degree of Freedom of 29, which is equal to 42.5570 for a confidence interval of 95% (“Critical values of the chi-square distribution,” n.d.). The result of analysis shows that the total X2 is equal to 25.401, which is lower than the critical value for a confidence interval of 95% (“Critical values of the chi-square distribution,” n.d.). Therefore, in both cases, the null hypothesis is accepted, which means that both variables, which are TD values and PY values, are independent.
Chi-square is the most plausible option since it is designed to compare observed and expected values for their statistical significance. The given method can provide a confidence interval-based outcome whether there is a statistical significance between two sets of values, such as Expected and Observed. When there are expected values and observed values available, chi-square is useful for testing the hypothesis between the expected and observed datasets. Chi-square is used primarily for the analysis of contingency tables, and it is a type of table that takes into account the combined effect of a factor on the outcome. The data in the contingency table should be presented as the frequency of nominal data or intervals, but not continuous quantitative values. It is worth noting that when working with conjugate tables, chi-square is often a support for analyzing the influence of risk factors by calculating risks, such as absolute and relative risks and odds ratios. The chi-square criterion is extremely widely used in statistics. In general terms, we can say that it is used to test the null hypothesis about the obedience of the observed random variable to a certain theoretical distribution law. The specific formulation of the hypothesis being tested will vary from case to case.
The results of the data analysis show that one can claim that a player’s PY or passing yard measurements is independent of TDs or touchdowns. The Chi-Square Test accepts the null hypothesis, which stated that TD values and PY values are independent variables. In other words, there is a statistical relationship between PY and TD values of a player, which means that measuring one’s passing yard metrics cannot predict his or her touchdown rates.
The key limitation of the study is the fact that chi square analysis does not indicate the strength of the relationship between values PY and TD, but only shows their independence from each other (“When Chi-square is appropriate – strengths/weaknesses,” 2021).
The main recommendation on the basis of the acquired results is that coaches, team managers, and players should not actively measure player passing yards or PY values during training and plays in order to predict TD rate because it will not be a strong predictor of touchdown rates of these players. In addition, a team owner and managers, who plan to acquire or buy a professional quarterback player from an existing team or recruit one from a newer pool of emerging players, should not look for passing yard measurements to predict the touchdown rates of these individuals.
References
Athlon Sports. (2019). Football field dimensions: How long and wide is a football field?Athlon Sports. Web.
Critical values of the chi-square distribution. (n.d.). Web.
Passing. (2020). Web.
The chi square statistic. (n.d.) Web.
When Chi-square is appropriate – strengths/weaknesses. (2021). Web.