Summary
This research reviews the performance of Gulf Cooperation Council (GCC) stock market for the last ten years. GCC consists of Bahrain, Kuwait, Oman, Qatar, Saudi Arabia, and the United Arab Emirates.
GCC market experienced rapid stock market activities since 2000. However, these growths changed in 2005 due to falling oil prices and increasing interest rates. Later, in 2009, effects of the global financial crisis forced stock markets into downward trends as investors apathy continued.
The last ten years of GCC stock market performances relied on expectations of investors. The region experienced increased initial public offers (IPOs). Investors preferred IPO stocks to other stocks due to expectations that such IPOs shall rise in prices than existing stocks.
However, this turned to be unfavorable as volatility in stock markets in the region persisted to 2011 due to political instability in Middle East and North Africa (MENA). The most affected were retail and institutional investors due to uncertainties in market conditions.
Introduction
Understanding performance of GCC stock market for the last ten years can help potential investors understand activities and trends of stock markets and make sense of possible activities in the feature. This is because stock markets are the main economic indicators of a country’s growth.
Until 2005, GCC stock market experienced extraordinary growth in its stock markets and economies. Analysts tended to believe that growths in economies relied on real economic principles and fundamental market conditions.
However, GCC states have poor historical records of their stock markets performances. This research explores past trends, factors influencing stock markets in GCC states, and the relevance of oil prices in GCC economies.
Trends for the last ten years
After 2003, GCC states experienced tremendous growths in their stock markets. Analysts observed that these rapid growths resulted from rising oil prices, increased corporate profits, and enhanced reforms (Al-Hassana, Delgadoa and Omranb, 2010).
Apart from Bahrain and Oman, other GCC states recorded an increase of 480 percent on average between 2003 and 2005. This was an exceptional performance in the region. The GCC outdid other Arab states in the Middle East.
Table 1: GCC Stock Markets Performance 2003-2005
From 2001 to 2005, the Saudi Arabia stock market (Tawadul index) grew by nearly 540 percent (Al-Rodhan, 2005). In the same period, Kuwait stock market also grew by 560 percent as Dubai stock market also experienced an increment of 1024 percent. The market capitalization varies significantly based on a percentage of the gross domestic product (GDP).
Therefore, we can use these figures to demonstrate the performance of GCC stock market and its high growth between 2002 and 2005. Al-Rodhan noted that the GCC stock markets of 2004 to 2005 would outperform the previous year. This is the exception of Bahrain and Dubai.
In 2005, market sentiment in GCC experienced dramatic changes. In the year 2006, stock market activities in GCC states dropped sharply.
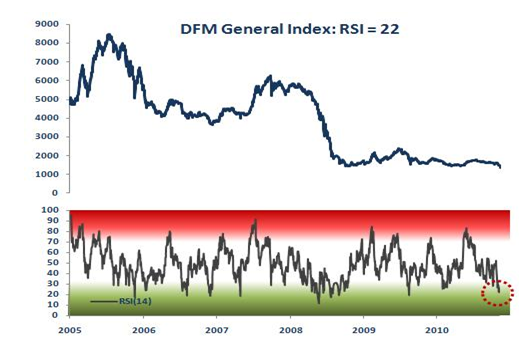
The table above indicates that the Dubai stock market declined sharply in 2005. In previous years, investors relied on increasing liquidity from oil prices, expanding economic activities coupled with low interest rates and elements of lucrative IPOs.
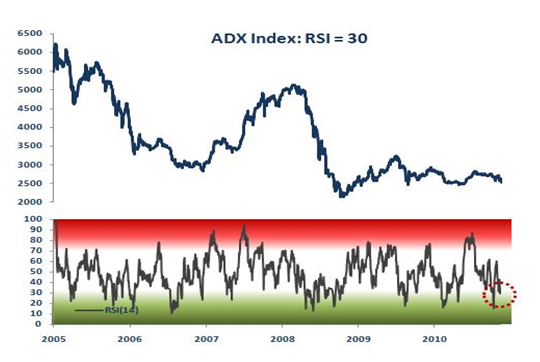
Kelleher noted that with “the exception of the smaller markets Oman and Bahrain, GCC markets generally exhibited a deteriorating and then depressed state through 2006, led by the downward trend set by the Saudi Arabian market” (kelleher, 2008).
In 2006, the UAE lost 42 percent of its value. According to Kelleher, market decline resulted from increasing interest rates, unfavorable region contagion, and unsustainable high valuations. The decline is broad-based and systemic in nature whereby small investors have avoided markets and institutional investors have disappeared.
During the third quarter of 2006, reported earnings dropped into the red. In November 2006, market drops resulted from the decline of Emaar stock. Analysts believed that too many “IPOs had reduced investor appetite for secondary trading investments” (kelleher, 2008, p. 1).
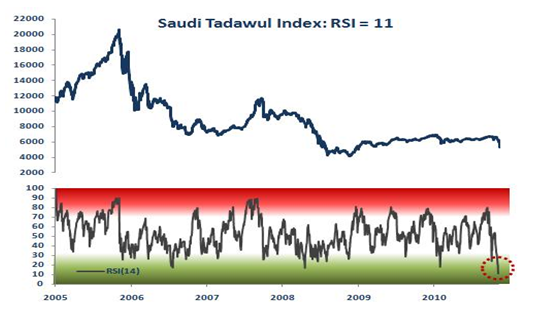
In December 2006, Saudi market experienced losses, which affected the region as investors continued to focus on DFM IPO. Investors rushed to sell shares to raise liquidity in weak conditions of the market. There were bearish activities in the market due to declining oil prices and introduction of stringent disclosure rules. The GCC stock markets experienced general apathy in all retail and institutional investors.
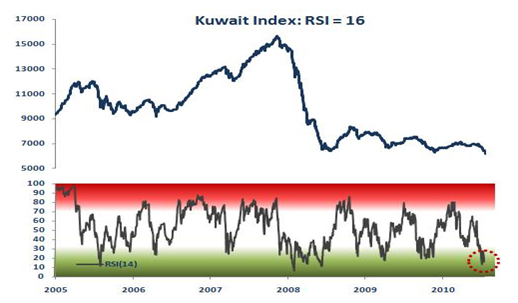
The Saudi index created a shock wave in the UAE stock markets. This made investors avoid stock markets for fear of plunging into losses.
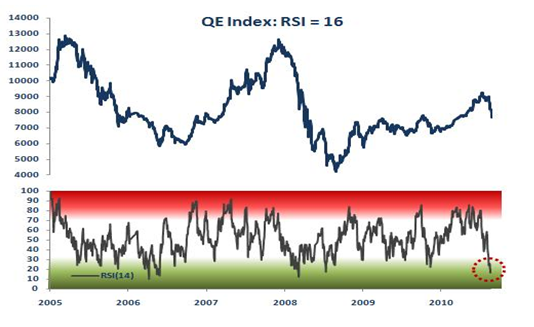
GCC stock markets have generally shown a declining trend followed with depressed states throughout 2005 to 2011. Saudi Arabia market leads GCC stock markets in these downward trends. However, in some cases, stock markets experienced positive gains.
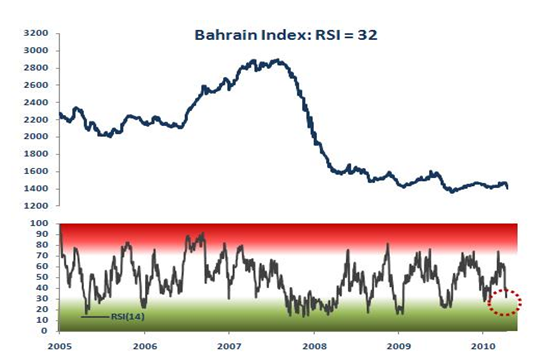
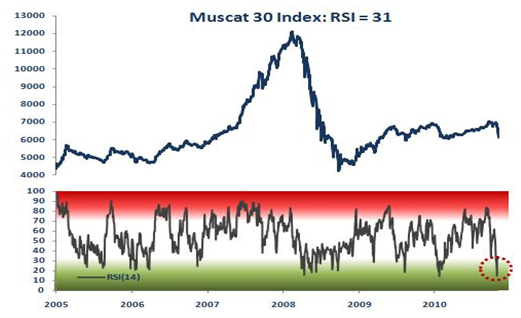
For instance, in 2008, Oman and Kuwait experienced the highest growth in value trade. However, GCC stock markets still experienced high volatility in market capitalization. During the year 2007, GCC recorded IPO listings of 33 compared to 23 witnessed in the year 2006 (Lyxor, 2008).
These listings improved market activities. The new IPOs brought foreign investors to GCC stock markets (Chaudhry, 2010). This was because of improvements in market sentiments within the year. IPO stocks proved to be better for investors than other stocks due to their appreciation. During the year 2006, the average IPO increased by 25 percent. However, in 2007, GCC stock market IPOs declined by 2.4 percent.
In 2008, UAE markets were the most affected by the financial crisis. Consequently, Dubai financial Market lost 72.4 percent while Abu Dhabi Securities Exchange lost 47.5 percent. During this period, GCC markets had to deal with rising inflation due to high oil prices and pegged currencies.
Still, oil prices dropped as the dollar strengthened. Investors remained speculative by betting on sustained high oil prices and chances of devaluation of GCC currencies against the dollar. However, this did not happen and the volume and value traded plunged among all GCC stock markets.
Abdullah observed that 2009 was a volatile year for stock markets in GCC (Abdullah, 2009). Markets declined due to effects of the financial crisis in the first quarter of 2009. During this period, credit default swaps (CDS) in GCC reached high-levels, which created chaos in markets. However, market trends improved due to governments’ stimuli plans.
Declining trends in GCC stock markets have affected most investment companies. The global financial crisis made it difficult for many companies to find other resources for servicing their foreign debts. This was because local banks could not cope with sudden increments in demand for corporate loans.
Local banks did not want to lend during unstable market conditions. At the same time, foreign banks lacked liquidity. Consequently, most corporate investment companies could not pay off or rollover their matured debts.
Market expectations influenced IPO market activities. Most companies prefer to go public when they expect market conditions to be stable and booming.
On the other hand, companies tend to avoid unstable market conditions while new IPOs experience decline in prices. The IMF reviewed its economic outlook for 2010 on GCC and noted that the region shall grow by 5.2 percent. However, it noted that markets needed some years for stabilization.
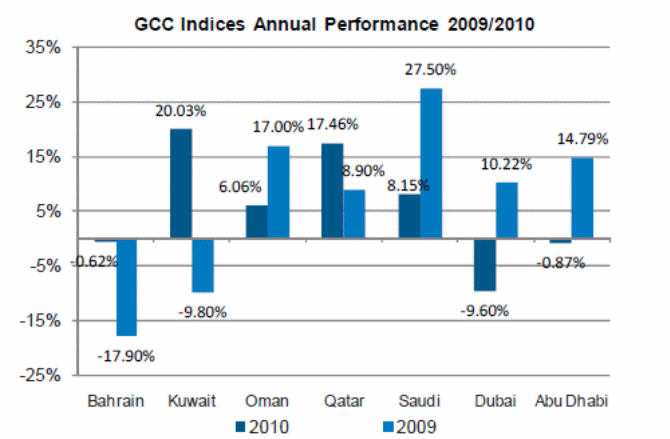
In 2010, GCC stock markets started on a better note. However, few days later, performance changed. Generally, markets recorded positive performances with the exception of Bahrain and UAE stock markets. The rest of the GCC stock markets managed some gains during the year 2010. The Qatari market performed better than the rest of GCC stock markets. It gained 24.75 percent during the year.
At the same time, the Global Qatar index achieved 17.46 percent. This includes all shares of all listed stocks. However, we have to note that most gains in Qatari took place in the last quarter during December 2010. This was the period when the country won the honor of hosting the World Cup Soccer in 2022. This event brought optimism in MENA and GCC regions.
The Global GCC Large Capitalization 30 index gained 15.77 percent as it ended at 320.57 points in 2010. This was because most of the investors focused on secured blue chips within the year. The total market capitalization of GCC listed stocks for the year was US$440.4 billion, which represented 58.7 percent.
The best performing firms included Saudi Basic Industries Corporation (SABIC). SABIC had 20 percent of the index among top performing listed stocks. This improved by 26.97 percent. Zain of Kuwait also performed well by gaining 49 percent by the end of 2010.
In 2010, trading activities at GCC were the lowest for the last seven years. During this period, the total volume traded declined to 169.38 billion shares (48.01 percent). This represented total value of US$296.76 billion, which was 42.6 percent drop.
This situation created uncertainties and made investors avoid markets. However, towards the end of the fourth quarter, markets improved due to positive sentiments from Dubai World Restructuring and stimuli budgets in most GCC states.
By the end of the year 2010, the number of listed companies in GCC stock markets increased by 12 companies to 706 compared to the previous year. During 2010, GCC stock markets delisted 13 companies as 25 new listings took place. However, most of the listings took place in Saudi and Kuwait stock markets.
Kuwait and Saudi markets had 11 new listings whereas other states like Oman, Qatar, and Bahrain had a single new listing each. The year 2010 experienced the highest number of decliners. This is the period in which 387 stocks ended the year with 243 gainers as 76 stocks remained static.
Table 2: GCC Stock Market Changes, 2010.
Source: Respective GCC Stock Markets and Global Research, 2010.
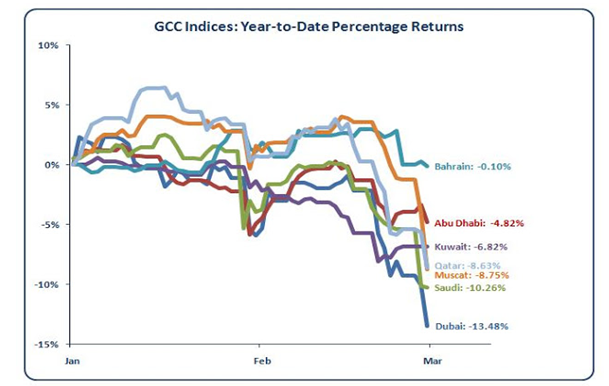
The year 2011 has not been favorable for GCC stock markets due to political conditions in the MENA region. All stock market indices dropped in performance.
Oil Price factor and other drivers of Fluctuation
Previously, increasing oil prices have favored robust stock markets in the region. However, drops in oil prices from 2005 to 2008 have created volatile conditions in GCC stock markets. Analysts also believed that prices oil would not rise in 2009. Consequently, GCC states experienced reduced revenues, which slowed their spending abilities.
This affected public spending. Consequently, it reduced robustness of markets in GCC. For instance, in 2009, Saudi Arabia incurred a budget deficit of US$17.3 billion for the first time in six years. However, some of the GCC countries were able to rely on surplus from previous years for a short-term basis. GCC states experienced this dilemma as analysts predicted that any possible expansion would be on hold.
Zawya aims to define the correlation between economic fundamentals and stock market performance together with enhancing investors’ awareness in stock markets. Analysts believe that ‘price in’ goes along with the economic fundamentals.
According to Zawya, the main economic indicators include Real GDP Growth every year, Current Account based on the percentage of the GDP, Consumer Price Index, and Total Government Debts and Gross Official Reserves all as percentages of the GDP. The correlation should be high in favorable economic fundamentals.
However, in a low correlation, we can only justify fund allocation for listed companies using company specific information, changes or developments in macroeconomic conditions, a favorable geopolitical environment, and market sentiments.
In this regard, economic fundamentals cannot justify allocations of funds into stock markets. These factors have strong influences on the stock market performances during uncertainties than economic fundamentals.
Therefore, market performances do not always move alongside economic fundamentals. This is because others factors like news and changes in market sentiments among others play significant roles in controlling market conditions.
This implies that investors who seek to maximize high returns from their investments must be creative in determining effects of market events on their investments, particularly in GCC current unstable political environment.
Conclusion
Until 2005, GCC stock markets have experienced rapid growths due to favorable oil prices, low interest rates, growths in corporate profits and enhanced reforms in stock markets. The past ten years have seen some dramatic and volatile stock market conditions. These resulted from the decline in oil prices, rising interest rates, investors apathy, liquidity in markets and political instability.
Stock market performances for the last ten years require creativity of investors to enable them achieve maximum returns from their investments. This is because of other factors, which are beyond economic fundamentals.
For instance, positive news and market sentiments, World Cup Soccer of 2022, turbulent political situations of MENA, and other factors have significant roles in influencing stock market performances of GCC states.
References
Abdullah, T. (2009). Volatile period – GCC stock markets witnessed challenging year in 2009. Global Arab Network, 2010, 1.
Al-Hassana, A., Delgadoa, F. and Omranb, M. (2010). The under-pricing of IPOs in the Gulf cooperation council countries. Research in International Business and Finance, 24 (2010), 344–360.
Al-Rodhan, K. (2005). The Saudi and Gulf Stock Markets: Irrational Exuberance or Markets Efficiency? Washington, DC: Center for Strategic and International Studies.
Chaudhry, I. (2010). Middle East Equity Markets: The Last Frontier of Investing. Web.
kelleher, S. (2008). UAE and GCC stock markets. Web.
Lyxor. (2008). GCC Economic Performance – An Outlook. Web.