Introduction
A simple pendulum consists of a hanging weight at the periphery of the string. The periodic time is the duration taken for one complete oscillation of the pendulum. With small swings, the model assumes a simple harmonic oscillator. The periodic time T of the motion is expressed by the below Galileo’s equation: T=2π√
Where g is the acceleration of gravity and l – the pendulum string length. The theoretical value of g is given as 9.8179 ms² . Experimentally, g is computed by utilising the collected data of L and T.
Materials
- Stopwatch
- A weighted bob
- A tape measure
- String
Methods
Part I
The string was securely attached to the weighted pendulum to allow free swinging of the bob. First, a string length of 80 cm was accurately measured using the tape measure. Afterward, the pendulum was slightly tilted and set into motion. The stopwatch was used to measure the recorded time taken to complete ten oscillations. Two subsequent trials were also undertaken for the same length of string. The preceding steps were repeated for the other lengths of 100 cm and 120 cm of the string.
Part II
Through the manipulation of the experimental periodic time and length data, a graph of the square of time T² against length L was plotted using the Excel software. A straight-line graph of the form y=mx was plotted by taking 1/g
m=4π²1/g and g=9.81 ms² using the same application.
Data
Results
The gravitational acceleration (g) was calculated by rearranging Galileo’s equation into g=4π² I/T²

The average value for the calculated gravitational acceleration is given by: g=9.750+9.583+9.702/3=9.6783 ms²
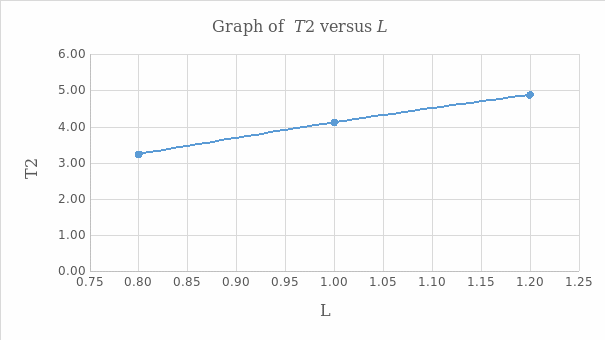
The plotted graph of T² versus L alongside the inherent tabulation were as presented below:


The slope of the graph is 4.11025 , which equivalent is to 4π² g.
Therefore, the value of g is given by:
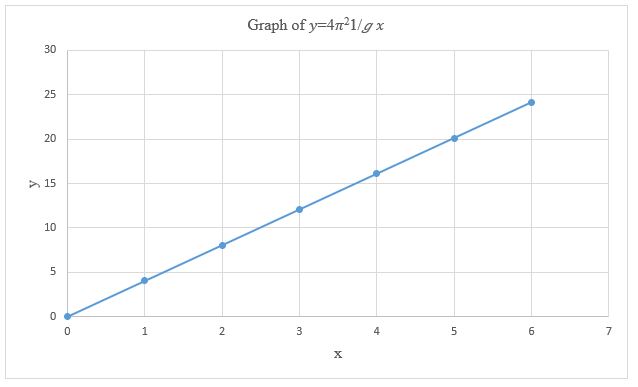
The table and the graph for the straight line y=4π² 1/g*x are illustrated as follows:

Discussion
During the experimental data tabulation, the average time taken by the ten complete cycles was divided by ten to achieve the periodic times for the particular lengths of swings used in the practical exercise. The respective data of length with corresponding periodic time were used to compute the calculated acceleration due to gravity (g). The average value of the g was found to be 9.6783ms²
The graph of T² against L generated a straight line plot with a positive gradient, thus implying that the square of the periodic time and length are directly proportional. The slope of the graph was obtained as 4.11025, yielding a gravitational acceleration of 9.607 ms². The relationship of T² versus L was also affirmed through the graph of y=4π² 1/g*x which produced a straight-line curve with zero origin.
The discrepancies of the experimental values of g from the theoretical figure were witnessed due to the introduced errors in the course of undertaking the practical. The possible sources of errors were the invoked inaccuracies during the measuring of the string length and the timing slips while using the stopwatch. Another conceivable fault was the statistical error and reaction time while undertaking the experiment.
Conclusion
From the experiment, the simple pendulum motion was studied and the delineation made on the relationship between the periodic time and the length of the swing. Additionally, the calculated and graphical values of acceleration due to gravity were found to be 9.6783 ms² and 9.607 ms², respectively. With the elimination of the few highlighted causes of errors, more accurate experimental results can be obtained.