Experimental Objective
The objective of this experiment was partly to compare the velocity ratios of a single-stage and double-stage geared winch, and partly to measure the corresponding mechanical advantage and efficiency under varying loads.
Theoretical Background
When focusing on simple machines their performances are evaluated based on mechanical advantage (M.A), velocity ratio (V.R), and efficiency. The paradox that one can relatively amplify the output force and still fail to proportionately amplify the output energy still baffles. This is so because work done is a product of force and distance. Vitally, according to the law of conservation of energy, it is surreal to obtain a greater output in energy than what is being injected into the machine. To this end, friction between the moving parts of a machine is the reason behind machines achieving efficiency shy of 100%. Consequently, simplifying the law of conservation of energy into a simple equation gives us:
Input energy= output energy + friction
Basically, when talking about efficiency one simply means the ratio of output energy to that of input energy expressed as a percentage. Thus, this is expressed as below:
Efficiency= (output energy/input energy)*100%
Of note, with respect to the initial equation, it is impossible for a machine to achieve 100% efficiency. The most that can be achieved is 98%. Nevertheless, its lower limit can be way below 50% (Uicker, Pennock & Shigley, 2003).
The mechanical advantage “is a ratio of the load to that of the effort exerted on the machine by the operator” (Uicker, Pennock & Shigley, 2003). On factoring friction, the ratio is expressed as below:
M.A = Load/Effort
However, in an ideal situation the friction is overlooked hence, the resulting M.A obtained is referred to as a theoretical mechanical advantage (TA).
On the other hand, when referring to the velocity ratio one simply means a ratio of the distance moved by the effort as exerted by an operator to that moved by the load but per unit time. This is simply expressed as below:
V.R = effort distance per second/distance moved by the load per second
With regards to this experiment, the main focus gears. As such, the velocity ratio is obtained by finding the ratio between the number of teeth of the driven wheel (N) to that of the driver wheel (n) i.e. N/n. Vitally, this ratio can be increased by several orders depending on the number of gears a system has. Basically, in a system of gears, it is not necessary to fix gears along a straight line; they can assume a parallel connection courtesy of a wheel-and-axel. In such a case, the total velocity ratio incorporates that of a wheel-and-axel i.e. radius of driver wheel (R) to that of the driven wheel (r). This arrangement can be represented as below:
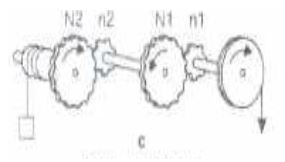
For the above system of gears the total velocity ratio is given as:
N2/n2*N1/n1*R/r
Experimental Procedures
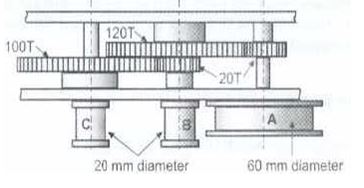
In this experimental setup, two pairs of twin experiments were performed. One pair was meant to test the velocity ratios for both single and double-staged systems while the other pair was meant to test M.A and efficiencies of the same. As such, a system of a geared winch (fig. 2) was fixed on a vertically mounted mounting panel ready for analysis.
For the first pair (i.e. V.R), and with respect to the single-stage system, pulley ‘B’ was rotated through one revolution while noting the number of revolutions made by the pulley ‘A.’ With established count on numbers of teeth on gears and radii of the wheel-and-axel the total value for the V.R was calculated and recorded. Using pulley C as the driver, the same experiment was performed for the double-stage system.
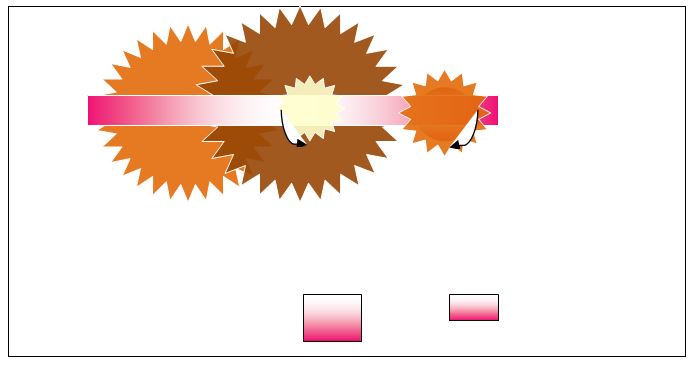
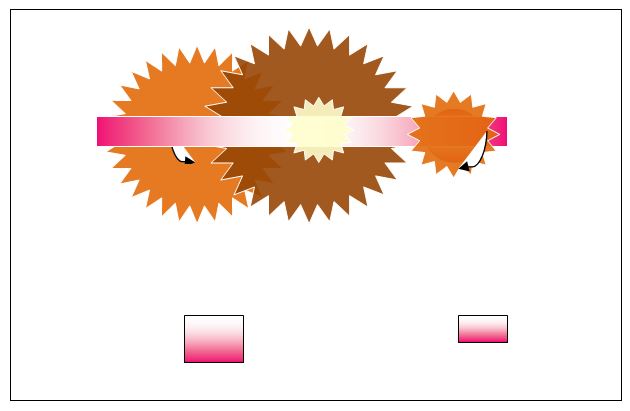
As for the M.A and efficiency, and with respect to the single-stage system (Fig. 3), two cords were wound around pulleys A (driver) and B (driven). While momentarily holding the load weight (W) constant, a small effort (P) was exerted on pulley A to make the load move at a steady velocity. These values were recorded for analysis. Of note, the values for the load were inclusive of the weight of the hook (0.1N). Hence, the load (W) was momentarily varied from 1.1 to 5.1 while recording the corresponding effort (P). While using C as a driven pulley and holding other factors constant the same experiment was performed for a double-stage system (Fig. 4).
Experimental Data
As regards the first pair of experiment, the following data was collected:
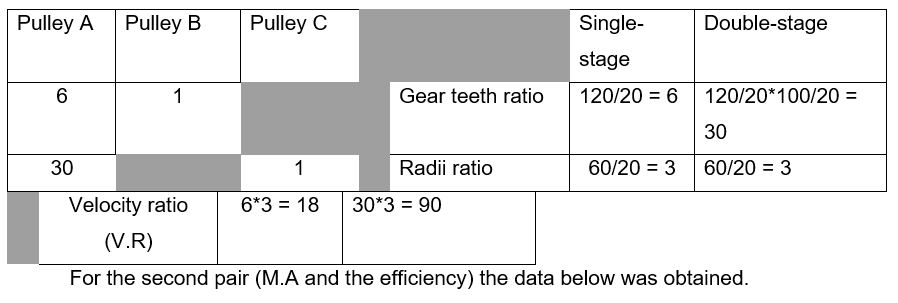
For the second pair (M.A and the efficiency) the data below was obtained.
Table 2: showing the M.A and efficiency of a single-stage gear system.
Table 3: showing the M.A and efficiency of a double-stage gear system.
Data Analysis
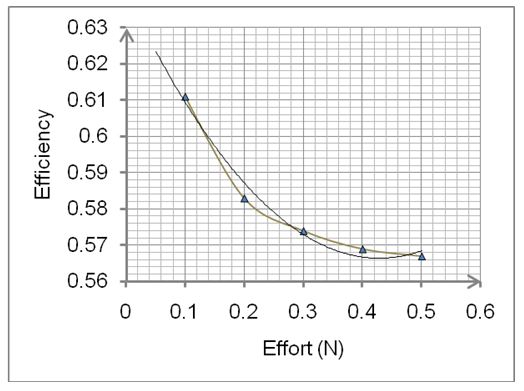
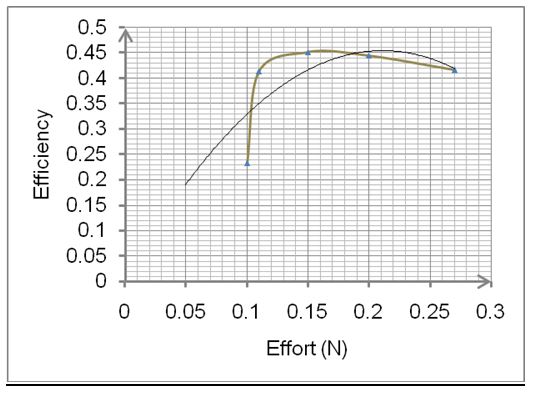
As regards the above tables, plots of efficiency against effort would portray the performance of the systems.
Discussion
The objective of this experiment was partly to compare the velocity ratios of a single-stage and double-stage geared winch, and partly to measure the corresponding mechanical advantage and efficiency under varying loads. Hence, as regards the velocity ratios as portrayed by the experimental analysis above (Table 1), it is evident that the double-stage gear winch has a relatively superior velocity ratio than a single-stage gear winch. In simple terms, the double-stage gear winch results in a greater effort distance vis-à-vis its load distance. Consequently, it is projected that a double-stage gear would exhibit a low overall efficiency on work done. Basically, the efficiency of a machine is directly proportional to the M.A and inversely proportional to the V.R. In a nutshell, a single-stage winch with an inferior V.R means that the load distance moves at a less distance relative to that of a double-stage winch, but for the same effort distance.
As for the mechanical advantage as exhibited by tables 1 and 2 above it is evident that a double-stage gear winch dwarfs its counterpart significantly. In a synopsis, a greater M.A means that for an equal effort a double-stage winch supports far much greater load than its counterpart- a single-stage gear winch. Of note, while the M.A of single-stage gear decreases with an increase in effort, a double-stage gear has an optimum M.A beyond which it decreases with an increase in effort. Consequently, an identical trend is expected when efficiency is plotted against effort (Graph 1 and 2).
Vitally, a lower efficiency in a double-stage gear winch is owed to frictional force which is relatively higher as compared to a single-stage gear. This is so because as opposed to its counterpart, a double-stage gear has comparably more surface in relative motion exhibiting varied coefficient of friction (Uicker, Pennock & Shigley, 2003). However, to compensate for this, for an equal load a double-stage gear winch boasts a superior M.A. This magnifies the efficiency significantly.
As for the direction of motion, unlike a belt drive a double-stage gear system results in an opposite direction of motion of wheels. To achieve the same direction in motion then the gear system should be composed of gears totaling to an odd number i.e. 3, 5, 7 to ∞.
Conclusions
In a conclusion, the objective of the experiment was met since it was established that the velocity ratio of a double-stage winch is more than that of a single-stage gear winch. On comparing the M.A, it was too established that the double-stage gear winch triumphed. However, with respect to efficiency, a single stage winch dwarfed its counterpart. Vitally, while a double stage gear had an optimum efficiency, its counterpart’s trend decimated with increased effort.
References
Uicker, J., Pennock, G. R., & Shigley, J. E. (2003). Theory of Machines and Mechanisms.New York, NY: Oxford University Press.