Objective
The experiment aimed to ascertain the physical factors that impact the pendulum’s period and eventual estimation of the gravitational acceleration.
Data and Calculated Results
The beneath data table shows the time taken for the mass of 100g to complete ten oscillations for the various amplitudes measured in degrees. The computed periodic time and gravity constant are also given against each amplitude.
Table 1. Period at varying degree amplitudes for mass (g) = 100g.
The below tabulation displays the covered duration by 200g mass to complete ten cycles alongside the equivalent calculated period and acceleration due to gravity for the various degree amplitudes.
Table 2. Period at varying degree amplitudes for mass (g) = 200g.
The following table gives the recorded time for ten swings alongside the computed gravitational acceleration and periodic time for the experimental mass of 300g for the weight’s varying tilts.
Table 3. Period at varying degree amplitudes for mass (g) = 300g.
The following section presents the tabulation of the time taken by the various lengths of string: 30cm, 45cm, 60cm, and 75cm, to make ten cycles when adjusted to different. The selected mass to undertake for taking and recording time readings weighed 100g. Additionally, the corresponding computed period at every orientation for the particular string length is also shown.


Calculations
Upon following the procedures, the readings of the time taken to cover the ten oscillations were read and recorded, as exhibited by the preceding tables 1 to 8. The periodic time was attained by dividing the time taken by ten, i.e.,
Periodic time, T = Time taken / Number of Oscillations
For instance, in table 1, where the recorded time taken for the ten oscillations was 8.92 at an alignment of 10°, the period was as follows;
Period = 8.92/10*0.89s
The expression was utilized for all the subsequent periodic times across all the given data tables.
The acceleration due to gravity, g, was computed by rearranging the following general formula:
For example, the gravitational constant in table 1 for the amplitude of 10°:
Tables/Graphs
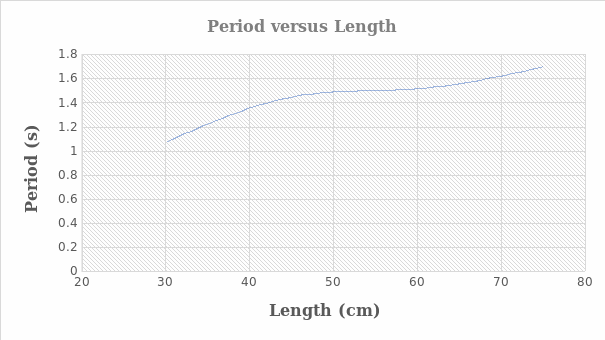
The plot of the period versus length utilized data from the experimental results at an amplitude of 10° and mass of 100g for the string lengths of 30cm, 45cm, 60cm, and 75cm.
Table 8. Tabulation of length against period at 10° for 100g mass.

Results and Interpretation
The purpose of the experiment was to explore attributes that affect a pendulum period and use the experimental period to approximate the gravitational acceleration. The pendulum was observed to swing faster with an increase in weight for the same length and amplitude. This phenomenon resulted in reduced periods with the gradual addition of weights; hence, it ascertains that mass affects a pendulum’s periodic time. Finally, the collected data was interpreted, and the given periodic formula was rearranged and utilized to calculate the acceleration due to gravity.
Error Analysis
The computed percentage error from the experimental data was found to be 3.22%. The error was attained by dividing the observed gravity constant with the theoretical acceleration due to the gravity of 9.81 m/s (Will, 2018). The error fell within the acceptable range of the gravitational acceleration; thus, it was necessitated by the random error contributors.
Impression and Questions
The lab work was vital as we could compute and comprehend the acceleration due to gravity. The synthesized data was collected by utilizing period, amplitudes, and various masses.
Questions
Average period = (0.906+0.924+0.953+0.986+0.999+1.008+0.922+0.949+0.972)/9 = 0.958s
- From observations, the period lowered with increment in weight but increased with the rise in amplitude for the same mass.
- The graph of the period against length demonstrated that the time taken to complete one oscillation increases with the length increase.
- The shape of the period versus length plot assumed the simple harmonic motion curve depicted by the equation describing the pendulum’s period.
Averagegstep1 = (12.027+11.563+10.870++10.154+9.892+9.716+11.613+10.962+10.449)/9 = 10.805 m/s2
Averagegstep2 = (10.247+9.826+9.58+8.490+8.058+7.908+10.309+9.686+9.006+10.296+10.081+9.873)/12 = 9.447 m/s2
Average experimental value of g = (10.805+9.447)/2 = 20.252/2 = 10.126 m/s2
Deviation = 10.126 – 9.81 = 0.316 m/s2
% Error = (Deviation/Acceptable value)*100 = 0.316/9.81*100 = 3.22 %
The percentage error is within the acceptable range, hence depicts the presence of random errors.
Error Sources and Concluding Remarks
The small percentage error of 3.22% was attributed to the presence of some human and random errors. The error would be alleviated by taking at least three measurements for every amplitude and utilizing the average value. Nevertheless, my findings were consistent and demonstrated that length and periodic time, which is greatly influenced by the object’s mass, affect gravity’s acceleration.
Reference
Will, C. (2018). Theory and experiment in gravitational physics (2nd ed.). Cambridge University Press.