Abstract
The lab’s objective is to demonstrate how the two systems provided in this lab approximate a simple harmonic (a simple pendulum and a mass on a spring). Throughout the lab, properties that make the system similar to a harmonic oscillator are determined together with the properties that hinder them from being simply harmonic oscillators.
The experiment’s success depends on the apparatus’s successful setting, with the oscillator having hanging string and masses added to increase the string’s tension. It was evident that the wavelength and the string tension correlated. As the tension increases, there is a significant decrease in the number of loops. In addition, there is a noticeable increase in wavelength with an increase in tension—the output data from the experiment used in carrying out analysis and producing graphs.
Results and Analysis
Output data
Impact of tension on wavelength
Table 1
Table 2
Table 3
The data were gathered by adjusting the tension on the string by adding hanging mass and measuring the wavelength using a meter stick.
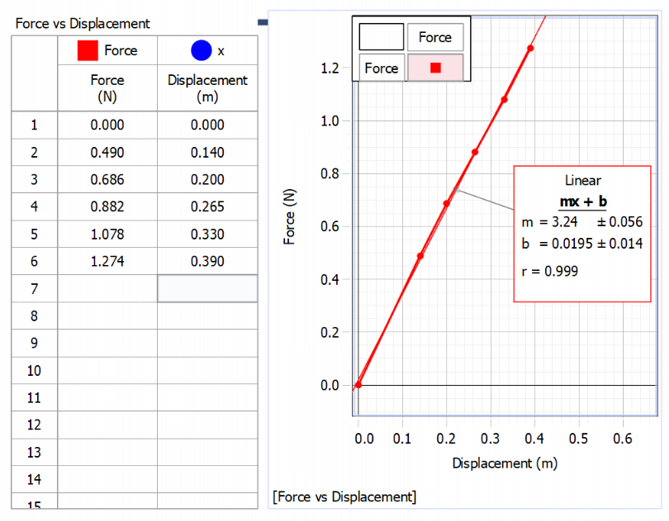
The Output of the Data Force vs. Displacement

Uncertainties
The resulting uncertainty is errors from humans when carrying out the measurements. The wavelength was determined using a meter stick, which may not be accurate to the nearest division. The error of the eye could also result in this uncertainty. Human errors are the largest source of uncertainty in this lab practical.
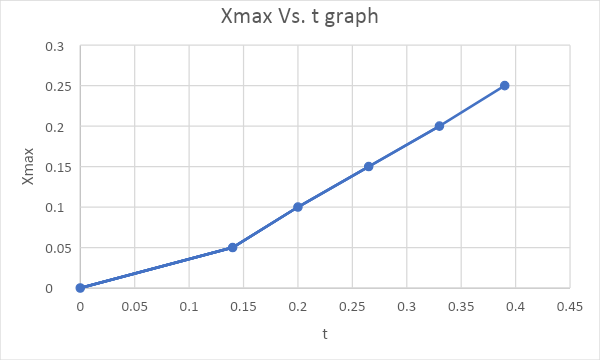
Based on the graphical techniques, the period depends on l directly in that, A decrease in the period leads to a corresponding reduction in l. The result achieved is what was expected in this lab practical. The relationship between t and d is when d increases, t also increases.
Uncertainty in this project got estimated by taking the actual value of g and comparing it to the prospected value of g with a deviation of the constant k.
The value of g = 0.371kg * 10N = 3.71N
The calculated value of g appears to be consistent with the accepted value of g. as observed from the graph; the slope value is 3.24 ± 0.056.
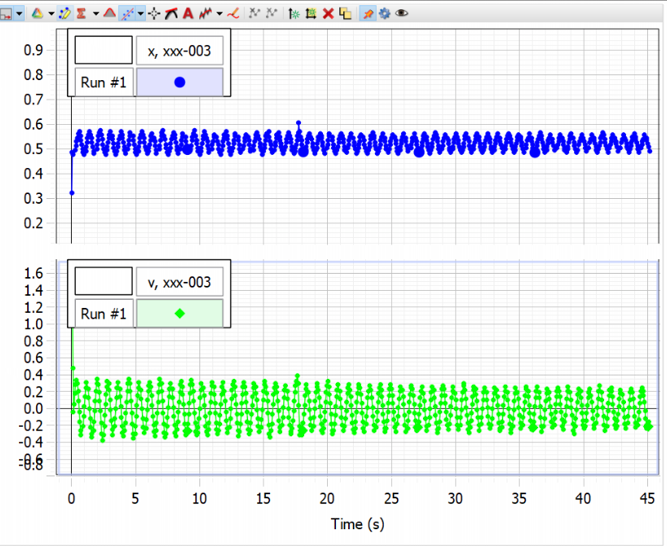
The output of velocity and displacement vs time

The portrayed graphs above represent how position and velocity relate. The two graphs relate in a manner that they all follow a straight line. The rate of change of distance to time is directly proportional therefore resulting.
Finding the T:
= A = delta-V / delta-T
T = delta-V/ delta-A
= 1.64-0.48/-16.85+6.25
t = 0.11s
Human error results from time uncertainty, although there is a little deviation from the expected value of T.

From graph 3 above, it is evident that the kinetic energy is conserved. Therefore, the system exhibits a simple harmonic motion. When the mass of the moving spring is calculated, the resulting T value is not consistent.
Reference
Cheney, C. P. (2018). Simple Pendulum and Hooke’s law prelab. Web.