Abstract
In this experiment, the main goal was to prove two hypotheses with respect to cellular respiration. The first was to test the hypothesis that respiration increases in the presence of carbohydrates as opposed to its absence. The other was to prove the hypothesis that pollutants decrease respiration rate. As such, two experiments were performed; one was to test the first hypothesis, and the other was to test the second hypothesis using simulated pollutants (10% salt concentration, isopropyl alc., 5% baking powder, and vinegar).
The results showed that the respiration rate increases in the presence of carbohydrates, as evident by the increase in CO2 gas produced (6.5ml/10min compared to 3.2ml/10min in its absence). This proved the first hypothesis. Also, the second hypothesis was proved when the results revealed a decrease in the CO2 gas produced in the presence of a pollutant (<4ml/10min).
Introduction
Cellular respiration is a process that involves the oxidization of food particles to carbon dioxide and water. The process of oxidizing the food particles takes place in two stages: the breakdown of food particles to pyruvic acid and oxidation of pyruvic acid to water and carbon dioxide (Del and Williams 45). Several factors affect the cell respiration rate. Therefore, the purpose of the experiment was to investigate the effects of pollutants on the cellular respiration rate.
As such, the objectives of the experiment were to: understand the importance of cellular respiration as a major process of life; understand the chemical equation for cellular respiration; understand the effect of changes in carbohydrate on the respiration rate as determined by the production of carbon dioxide; and to understand how pollutants harm life by interfering with cellular respiration.
The experiment was carried out to prove the hypothesis that carbohydrates increase cellular respiration rate as opposed to its absence, evident by the volume of carbon dioxide produced. Moreover, the hypothesis that the presence of a pollutant harms the rate of respiration was investigated by studying the volume of CO2 emitted (Lambers and Miquel 12).
Methods
Effect of carbohydrate on cellular respiration
In this experiment, the initials Y, W, S were used to represent the contents of the beakers as yeast, water, and sugar, respectively. A known quantity of 1.25ml of active dry yeast (Y) and 1.25 ml of granulated sugar (S) was measured and placed together in beaker 2 (Y+S). The mixture was thoroughly mixed by swirling the beaker. 13ml of warm tap water was measured and put in each beaker. The beakers were swirled to mix the contents thoroughly. The contents of beaker one were emptied into a culture tube.
Vial number 1 was inverted and placed over culture tube number 1. An index finger was used to push the culture tube up into the inverted vial 1 and held in position using the other hand. Vial number 1 was carefully set on the lab table and left undisturbed.
The initial gas volume in the culture tube, 1 was determined and recorded in Table 6.1. Time was recorded as t=0. The steps were repeated for beaker 2, vial 2, and culture tube 2. The volume of gas in each cartridge at intervals of 1 minute for 10 minutes was determined and recorded in Table 6.1.
Effect of a pollutant
1.25ml of dry active yeast and 1.25ml of granular sugar was measured and put in a 25ml beaker. The beaker was swirled to mix the reactants thoroughly. 10ml of warm water was measured using a graduated cylinder and added to the 25ml beaker. The beaker was swirled to mix the contents thoroughly. 3ml of simulated pollutant, isopropyl for group 1, vinegar for group 2, 10% salt solution for group 3, 5% baking soda solution for group 4, 1% bleach solution for group 5 and 10% soap solution for group 6.
Procedure for part A was repeated, and contents in the 25 ml beaker transferred to a culture tube and inverted into a vial. The initial gas volume was determined and recorded. Time was recorded as t= 0. The volume of gas was recorded at intervals of one minute for a period of 10 minutes. Table 6.2 was completed by recording the appropriate data from other groups. The total volume of carbon dioxide produced in each of the eight tubes was calculated and recorded. Also, the rate of respiration was determined.
Results
The results obtained for the experiments are presented in the appendices. Table 1 shows the volume of carbon dioxide emitted for different combinations. On the other hand, Table 2 shows carbon dioxide emitted for different combinations of different simulated pollutants. Finally, Table 3 shows the cellular respiration rate (ml/min) for six combinations of yeast, water, sugar, and simulated pollutant.


Discussion
In this experiment, the main goal was to determine the effects of pollutants on the cellular respiration rate. As such, this experiment was on one part designed to prove the hypothesis that the respiration rate increases in the presence of carbohydrates as opposed to its absence, and on the other part, wanted to prove the hypothesis that pollutants decrease the rate of respiration rate.
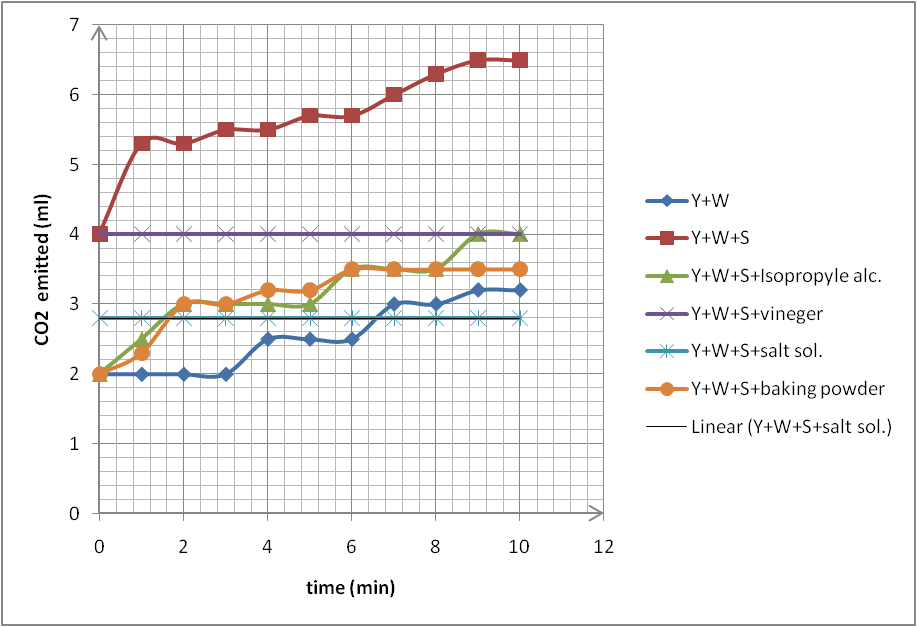
Results from table 1 in the appendix show that the volume of gas produced increases with time. This was meant to prove the first hypothesis. At time t = 0, the volume was 2 ml while at time t = 10, the volume was 3.2 ml. On further addition of sugar, the volume of gas produced increased. This showed that the presence of carbohydrate increases the cell respiration rate.
Respiration is a process whereby carbohydrates (e.g., glucose) are broken down in the presence of oxygen and water to yield energy as the main product, with CO2 and H2O as the main byproducts. This reaction can be summarized by the equation below:
C6H12O6 + 6O2 + 6H2O ATP + 12H20 + CO2
According to Lambers and Miguel (2005), an increase in glucose level increases the rate of respiration. Lambers and Miguel (2005) noted that glucose supplies the energy required for metabolism, thereby increasing the rate of respiration. This is highlighted in Graph 1, which shows the volume of CO2 gas produced in the presence of sugar (Y+W+S) to be higher than when it is absent (Y+W). Water is vital for respiration since it enhances the mobility of sugar molecules into the sites for respiration.
The absence of sugar substrate in the opposite beaker meant that the yeast was utilizing its reserve sugars to produce CO2. This could not be compared to the yeast on the opposite beaker, which had sufficient sugar substrate in its immediate environment to metabolize, producing excess CO2 (Del and Williams 49). This result was expected according to the hypothesis above.
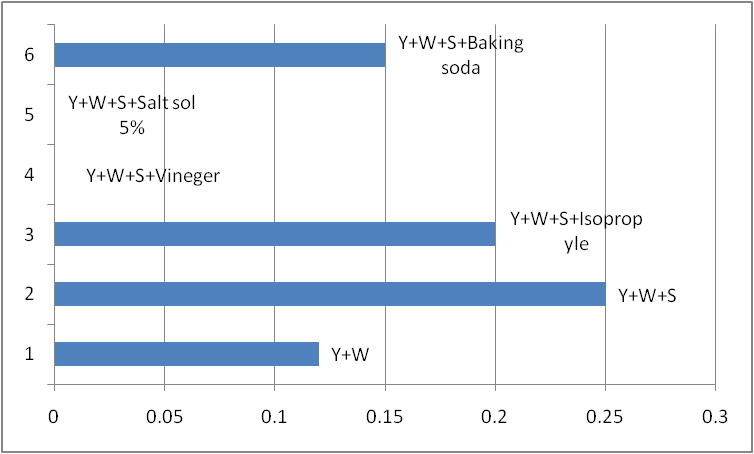
Table 2 (in the appendix) presents results for gas produced when a pollutant is added. Comparing the results in Table 2 with that in Table 1, the volume of gas produced per minute is lower in Table 2 than in Table 1 when sugar is added. Further analysis in Table 3 (appendix) shows the respiration rates. This is clearly depicted in graph 2 (when the rate is zero, it means that there was no change in CO2 gas produced with time). From the results, it is evident that pollutants slow down the respiration rate.
In the same way, Del and Williams (2005) found that impurities and pollutants significantly reduce the respiration rate by interfering with metabolic functions. Of the four pollutants, salt solution at 10% concentration was the most lethal pollutant, causing the lowest volume of CO2 gas produced by the yeast. Ideally, a salt solution is a hypertonic solution that draws water from the yeast cells causing it to become flaccid (Del and Williams 49). This interferes with the normal metabolic activities.
In this experiment, the uncertainties were minimal; however, future experiments ought to adopt other methods that are sensitive in recording the precise volumes produced for accurate analysis.
In conclusion, the experimental objectives were met, proving the above hypotheses to be authentic. As such, it is true that the respiration rate increases in the presence of carbohydrates as opposed to its absence. Also, pollutants decrease the rate of respiration by interfering with normal cell functioning. Experiments with no carbohydrates (sugar) recorded low gas production.
On the addition of sugar, the volume of gas produced increased. The experiment carried out with pollutants present, recorded low gas volumes. The salt solution at 10% concentration was the most lethal of the pollutants recording the lowest gas produced at 2.8 ml in volume.
Works Cited
Del, Giorgio, and Williams Peter. Respiration in Aquatic Ecosystems. Oxford: Oxford University Press, 2005. Print.
Lambers, Herbert, and Miquel, Ribas. Plant Respiration: From Cell to Ecosystem. Dordrecht: Springer, 2005. Print.
Appendices
Appendix 1: showing the volume of carbon dioxide emitted for different combinations.
Appendix 2: showing carbon dioxide emitted for different combinations of different simulated pollutants.
Appendix 3: showing the cellular respiration rate (ml/min) for 6 combinations of yeast, water, sugar, and simulated pollutant