Introduction
The purpose of the present work was to examine population patterns for a dummy population and data on the deaths of 80 individuals. The study of such patterns is necessary to understand better the mechanisms that influence populations, as well as to look for hidden relationships between variables. The variables in the paper were generation size and age of the cohorts. Of interest was an analysis of how population dynamics were related to these variables, that is, whether there were any discernible relationships.
Modeling Population Growth Lab Exercise One
For our first exercise, Modeling Population Growth, I was tasked to simulate the growth or decline of the human population based on rolling dice. In this simulation, dice with one or four dots were considered birth, dice with two, three, or five dots were considered nothing, and if you had six dots, then that was considered a death. I was given 100 miniature dice and the experiment had us start by rolling only four dice. If you had a birth, you were expected to add dice to the pile before the next roll, and if you had a death, you were expected to remove the dice from the pile. For example, if you had three births and one death in a roll, you would have to add two dice to your pile before the next roll because one death cancels out one birth. The expectation was to do this until you reached a population of 100 or more.
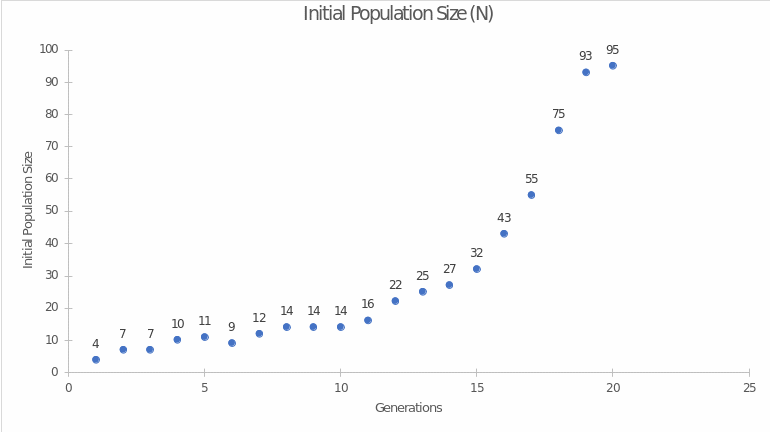
Conducting this simulation took me twenty generations to reach a population of greater than 100, ultimately, I ended in generation twenty with a population of 109. I felt lucky with my rolls at the beginning of this simulation because if you rolled too many sixes, then you could easily become extinct and were expected to start over. Thankfully, with the dice rolls I had, I did not end up encountering that problem, nor did I come close. The relatively low growth rate of the population may be due to the fact that the population was a sexually evolved individual with sexual differentiation. In such populations, an individual must go through stages of natural selection and struggle for survival, which include mating and mate attraction, before giving offspring (Thines, 2019). For this reason, population increases may not be as rapid as in the case of asexual reproduction, where such steps are not required.
As the dynamics of this population shown in Figure 1 suggest, the increase did not have a linear trend but an exponential one. This means that the increase in this population occurred at a much higher rate than in the case of linear growth. Eventually, such dynamics would mean that this population could reach infinity, but the exponential model can be applied to the population only to a limited extent, as it does not take into account the pressure of external and internal restraining forces.

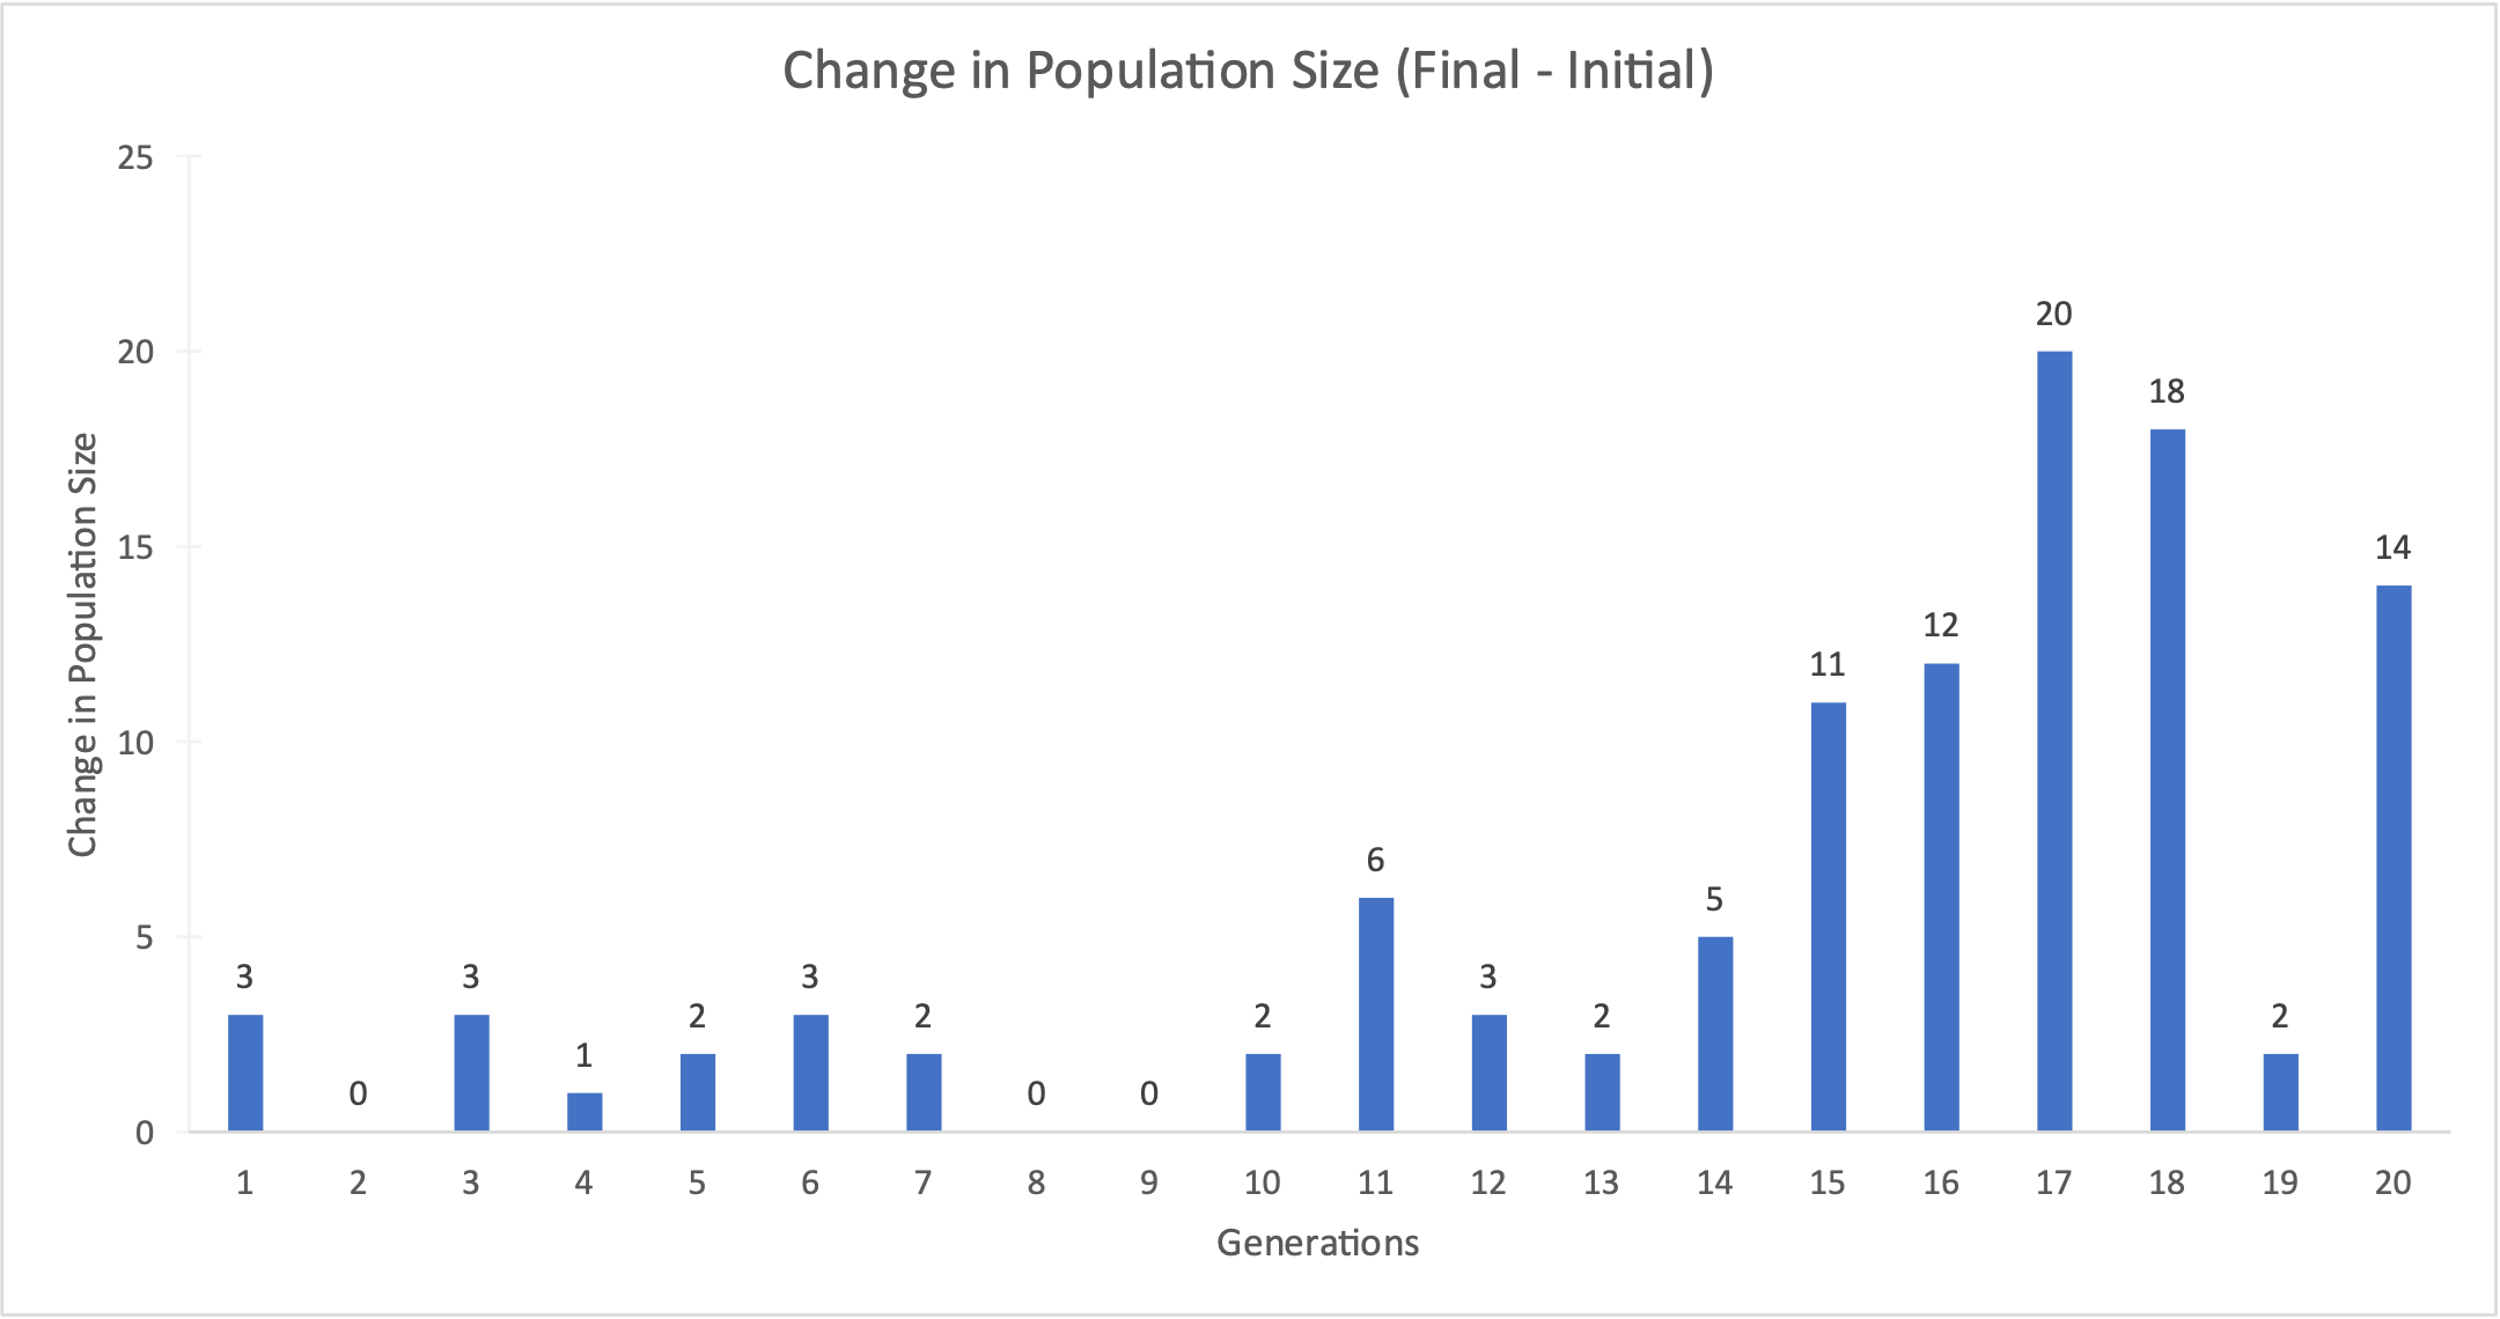
For the net changes in population size as a function of generation, there was a noticeable pattern that the largest changes are characteristic of populations of the largest size. This is noticeable as a shift of large frequencies to the right, i.e., toward the maximum population size, as follows from Figure 1. The largest change, however, was characteristic of generation 17, which means it is incorrect to postulate that the magnitude of the net change is linearly related to population size. A relationship does exist, but it is likely to be of a different nature. In larger populations, the probability of deaths or births turns out to be higher, so such an increase in change may be due to an actual increase in that probability.

It is noteworthy that this laboratory work did not impose any constraints on population growth, that is, size and changes in generations were determined only by statistical probability for playing cubes. In real life, communities within an ecosystem are subject to a huge number of limiting factors and barriers that prevent this growth. Thus, the pattern of change from generation size may be somewhat different for real populations. The theoretical model, unlike the real one, can have unlimited growth since there are no restrictions on this growth. However, in the case of real communities, infinite growth is not possible for any population (Smil, 2019). Internal and external restraining mechanisms begin to put pressure on growing populations, leading them to either restraint or extinction, but in either case, do not contribute to infinite growth.
Investigating a Human Population Lab Exercise Two
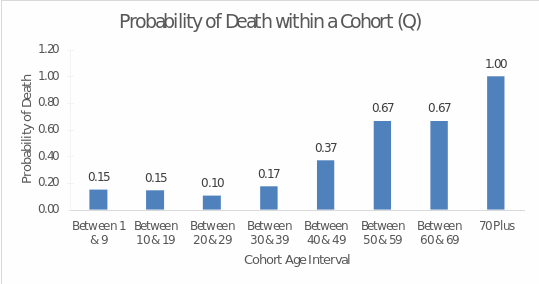
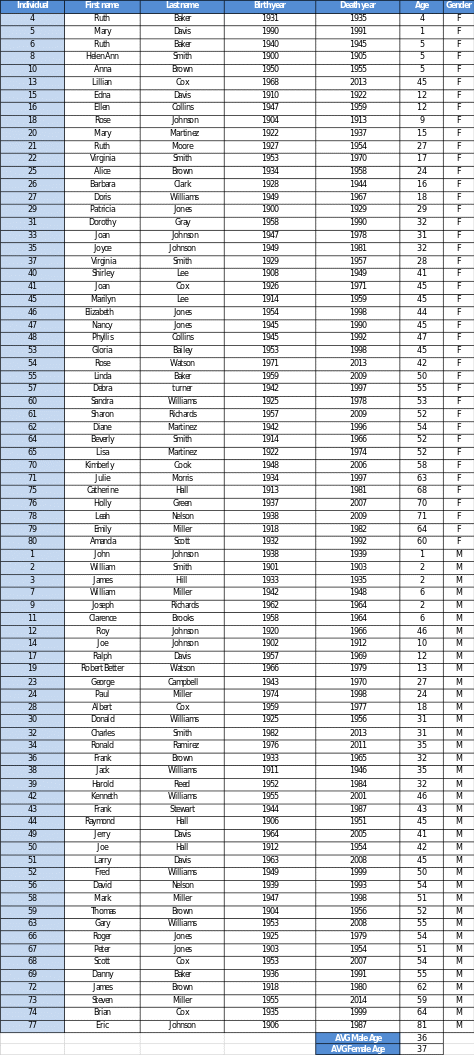
For our second exercise, Investigating a Human Population, I had the option to go to a cemetery and gather data, or I could use a data table provided by the lab. Due to inclement weather reasons, I chose to use the data table provided by the lab for this experiment. Essentially, I was given the names of eighty fictitious deceased individuals, their date of birth, and the date of their death. With that information at hand, I then calculated each person’s age and made a note if they were male or female. One of the tasks in the exercise was to determine which cohort had the highest probability of dying, and it was determined that the age group 70 years and older best fit this category, receiving a value of 100%. The cohort with the lowest probability of death fell into the age group 20 to 29, receiving a value of 10%. At the same time, as seen in Figure 3, the older the individual was, the higher their chances of dying were overall. This means that the older generation is more likely to die than the younger.

For this sample, there were 80 records of human deaths, 38 of which were females and 42 of which were males. Thus, there was no one whose gender in the binary system could not be determined by name analysis. Notably, the mean age of the sample was 36 years, meaning that they were predominantly young people. For men, the median age of life was 36, and for women, it was slightly higher, it is 37. From this, one can make the cautious choice that life expectancy for women is slightly higher than for men.
Table 1. Baseline mortality records for 80 people

Significant reductions in state prenatal and infant support programs could lead to a shift in the pattern of deaths, that is, an increase in the proportion of deaths at the earliest age. This could also affect the lives of pregnant women, who would lose the opportunity to receive quality health care services. As a result, the 20 to 50 age group, which includes women who are able to give birth, may also undergo changes in the statistics of deaths due to adverse childbirth.
Conclusion
This paper investigated population ecology patterns for two exercises. The first was based on a statistical experiment involving throwing dice, and the second used information on the deaths of eighty people. The general results found in this work can be summarized as follows. The population formed had exponential growth and, theoretically, could grow indefinitely, but in real life would experience pressure from internal and external environmental forces. The chances of dying were higher in the older generation, with the pattern being age-related. However, this pattern might have been altered by worsening state support for infants and pregnant mothers.
References
Thines, M. (2019). An evolutionary framework for host shifts – jumping ships for survival. New Phytologist, 224(2), 605-617. Web.
Smil, V. (2019). Growth: From microorganisms to megacities. Mit Press.