The Concept of Price Elasticity of demand in Healthcare
Elasticity
Elasticity means to the amount of receptiveness shown in supply side or demand side relative to variations in price. If a curvature is much more elastic, then minute amends in price will make big variations in quantity used. If a curvature is not as much of elastic, then it will make big amends in price to cause a variation in amount used. It can be illustrated by the form of the supply side or demand side curve.
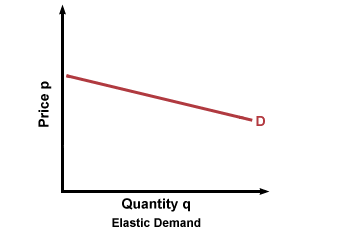
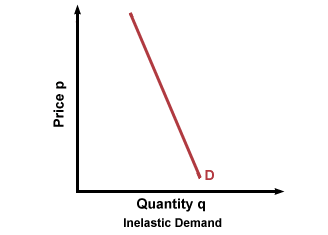
Price elasticity of demand
It submits to the extent of receptiveness in demand side quantity in relation to price. In the example given below demand side is very elastic. It can be seen that if the price varies from US$ 0.75 to US$ 1, the quantity amount lowers.
Explanation behind this can be that the purchasers might have access to an alternate medicine, so that as the increment in price occurs, he does not accept it. Other explanation could be that the purchaser didn’t find the medicine good enough, so any little variation in price has a big impact on the medicine’s demand.
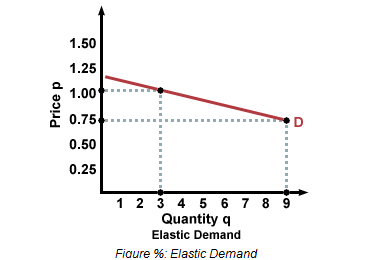
Source: Quantity q Elastic Demand
Healthcare – A general view with reference to price demand elasticity
The healthcare sector constantly experiences price elasticity on its demand side regardless of different methodologies and researches. Even though the array of price elasticity approximations is comparatively broad, it inclines to middle on minus 0.17, implying that one per cent raise in the amount of price within healthcare sector will direct to a 0.17 percent decrease in expenditures.
The variation caused by the price factor in the demand side can be associated to variations in the prospect of reaching any care rather than the variations in the frequency of stopovers.
Additionally, the research constantly discovers lesser amount of demand elasticity at lesser stages of sharing cost. The health side demand is also believed to be inelastic in respect to income. The approximations of elasticity on the income level are in-between 0 and 0.2.
The optimistic signal of the elasticity standard suggests that as income level rises, the demand side will also experience a rise. The scale, though, proposes that the demand side reaction is moderately little. Healthcare demand is considered by many specialists to be inelastic.
If a person is ill, he is not going to show sensitivities in price. However some do fall away from the domain or e.g. surgery such as any form of plastic surgery or when you are buying eyesight glasses. Price elasticity was -0.2 in a study conducted by RAND Health Insurance for medicine expense .
Is the demand Elastic-Healthcare
Another research suggested that the healthcare associations with prices are elastic. Its outcome suggests that the elasticity of healthcare and price are at -2.3 diagonally 0.65 to 0.95 tier of the allocation of expenditure, with a spot-wise 95precent assurance space at the 0.80 tier of -02.5 to -02.0.
Even though the research permits to project the change with the degree of expenditure, it concluded that the projections were quite steady over the projected tier. As the quantity side is associated with the price side, it requires unsystematic surprise to quantity side in respect to recognize elasticity.
When a family member has an injury, it would not influence the healthcare spending of others within the family i.e. if they are not facing injuries themselves. Though, the damage will utilize up a big section of a family’s amount and hence bring down the insurance of the whole family rates from hundred percent to twenty percent .
Few illustrations
Price division is the expression used to explain diverse shapes of straight charging for medical treatments. In the United Kingdom, a lot of citizens have to give treatment charges that they are liable to pay whenever they require treatment or are given prescriptions. This treatment charges have their own effects.
In projection, it is shown that the treatment’s demand is somewhat inelastic to price, having a negative 0.32 mean value. This implies that the treatment expenses charged are a good method to get funds, but they do not have an impact of any significance over demand.
It was established in the research that increment in the treatment money charged from the 90’s i.e. 3.75 pounds to 4.25 pounds accumulated into a hefty amount which is thought to be in excess of 17 million pounds in additional returns but what they did was, it guided to a drop of 23 hundred thousand in the figure of treatments and prescriptions given.
This study also recommends that with the passage of time, treatments and remedies disbursed will become more and more elastic to price. The Hughes and McGuire research concluded that the increment in treatment services in healthcare are going to lift lesser proceeds but in turn direct to larger decrease in usage of approved medications compared to what it did during the past .
During the year 2005, Ireland was graded the least of the European Union in relation to the medicine cost per occupant. The major causes for such a boost in Ireland included the prescription of fresher more pricey drugs, the amplified quantity of treatments as well as the alterations which took place in the qualifying standard.
During the year 1997, the standard charge per disbursed medicine was around 11 pounds to 11.50 pounds in contrast with twenty three to twenty four pound in the year 2007. As the overall populace demographic patterns are altering, the prescription rates are also altering. Since the number of older people in Ireland has been increasing, the demand for treatment has been increasing too.
It can be established that the demand in healthcare within Ireland is correlated as the prices of medicines are elastic to number of patients being treated. Similarly, the prices of medicine are also found to be elastic to the number of medicines disbursed. From the year 2000, Ireland has faced an upward trend in prescriptions of defensive/preventive drugs or treatment, a good example for which is the Statins .
In a study carried out in the state of Massachusetts a subsidy was endorsed, for a chance to calculate the healthcare demand for the price elasticity function. The MEPS from the year required 2005 to the year 2007 demonstrated the figures that the people put out or consume over healthcare outflow, a substitute for the amount needed i.e. the demand and their average healthcare funding consumption, a substitute for the pricing.
The graphs presented below, depict the points showing the descending inclination of the demand curvature. The elasticity for demand for the years 2005 and 2006, and the years 2006 and 2007 price is -1.95 and -0.18 respectively. Both are found to be inelastic, which means a sharper curvature for demand, which signifies a bigger advantage from the healthcare sector financial support.
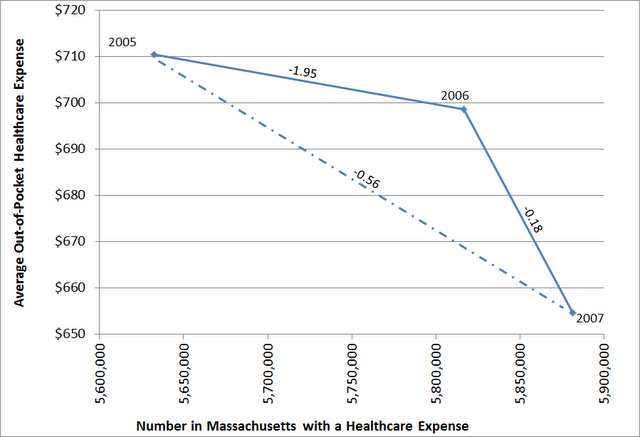
Source: Number in Massachusetts with a Healthcare Expense
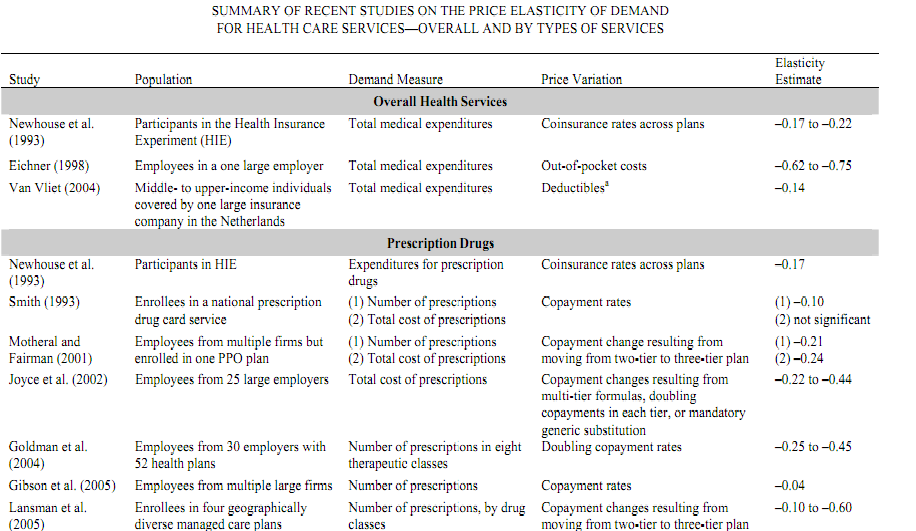

Source: Summary
Works Cited
Barry, Michael, et al. “Projecting the Impact of Demographic Change on the Demand for and Delivery of Healthcare in Ireland.” 2009. Web.
“Elasticity.” 2011. Spark Notes. Web.
“Is healthcare demand elastic?” 2009. Healthcare Economist. Web.
Liu, Su and Deborah Chollet. “Price and Income Elasticity of Demand for Health Insurance and Healthcare Services: Acritical Review of the Literature.” 2006. Mathematica. Web.
Maguire, Jon. “Hotspots for Healthcare Savings.” 2011. My Data Mine. Web.
“Price elasticity of demand (PED).” OheSchools. Web.
Ringel, Jeanne S., et al. “The Elasticity of Demand for Healthcare.” 2005. Web.