Focusing on Supply
This paper is focused on a demonstration of the principles of economics using an article from a recent newspaper that covers the issues of supply and demand. The events explored in the article will be used as examples in order to provide the basis for the theoretical and practical explanations. The article chosen for this work explores the issues faced by the fast-casual restaurant chain Chipotle and several factors that significantly affected Chipotle’s income and reputation.
The article, “What Do Rising Avocado Costs Mean for Your Next Chipotle Order?” by Sabrina Rojas Weiss, was published on the news portal Refinery 29 on July 31, 2016. As the title makes clear, the author of the article explores the effect on the profit of Chipotle restaurants produced by a change in the price of avocados. The price for avocados that are mainly imported from Mexico is one of the supply shifters known as the resource price (6 Supply Shifter Factors, n.d.).
In the article, Weiss (2016) reported that the surge in avocado crop production typical for July had not occurred and that was why the supply of this product had turned out to be poorer than anticipated. In turn, the price for avocados grew by 46% (1.25 dollars per piece). Accordingly, the change in the quantity of the supplied avocados, as well as their price, affected the prices of the end products at Chipotle.
Even though the increase in the price for the Mexican avocados seems minor to the average consumer, this small change has been very significant to the large chain of fast-casual restaurants that is Chipotle. In fact, the restaurants sell quite a lot of guacamole and other foods that include avocados as one of the key ingredients; in practical terms, as reported by Weiss (2016), the chain goes through as many as 97,000 avocados on a daily basis. This enormous quantity of fruit makes the increase in price very costly for the restaurant chain. As a result, the prices for Chipotle products inevitably were increased so that the chain would be able to cover the cost of the pricy Mexican avocados.
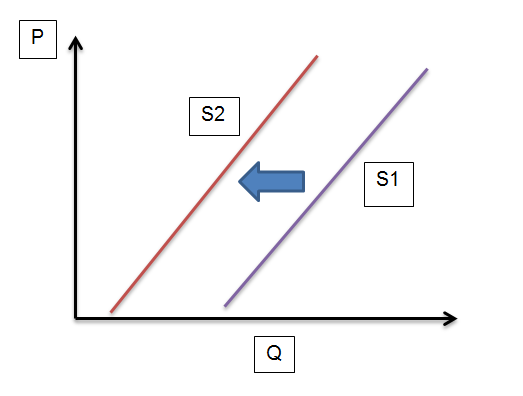
The change that the unstable production of crops in July created is shown in Figure 1 below. The graph demonstrates the effect due to the decrease in the quantity of the imported avocados (horizontal axis reflects quantity); the price of the fruits sold to Chipotle went up (vertical axis reflects price). As a result, the supply curve (S1) shifted to the left turning into S2, which indicates the decrease in supply.

Focusing on Demand
In addition, in her article for Refinery 29, Weiss mentions another factor that significantly affected the demand for the foods sold by Chipotle. To be more precise, not so long ago, the chain found itself in the middle of a very unpleasant and image-breaking scandal. In particular, according to a report made by Kyle Stock (2016) on Bloomberg, the end of the fiscal year of 2015 is now recognized as the most challenging period in all the history of Chipotle.
Namely, the sales of the chain were documented as having declined by almost 7%, which represents 14.6 fewer burritos sold per hour; the decrease in sales overall equals a decline of 17% over the entire year of 2015 (Stock, 2016).
This change is mainly explained by unreliable food safety issues since many of Chipotle’s customers had reported being affected by food poisoning. Food Poison Journal published an article that states that the cause of the poisonings attributed to Chipotle’s food was an outbreak of E. coli that spread to 14 states (Stearn, 2016). Logically, the consumers began to prefer buying their meals from competitors of Chipotle who offered a higher level of food safety.
Using economics terms, it is possible to state that the major driver of the decline in the demand for the foods sold by Chipotle is the number of consumers. Since the meals served by Chipotle started to be labeled by word of mouth as dangerous, the clients migrated from Chipotle to the other fast-casual or fast food chains that are numerous in the United States.
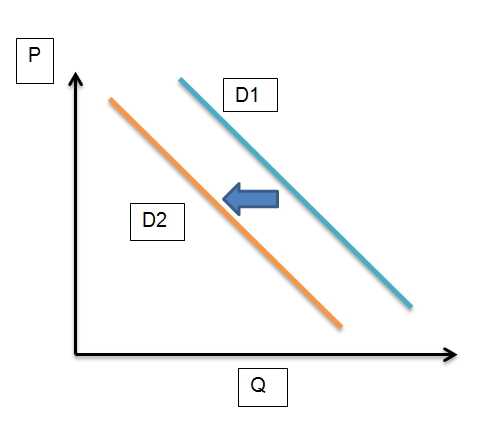
In that way, Chipotle, whose brand image was built on offering higher food quality than that of the competitors, lost a large number of clients and a portion of the profit. The change is shown in the Figure 2. Under the influence of the demand shifter (the decreased number of consumers), the demand curve of Chipotle shifted to the left, which indicates the decrease in demand for the production of the chain.

Supply-and-Demand Graph
The two factors explored previously—the outbreak of E. coli and the poor harvest of avocados in Mexico—served as the shifter of the demand for and supply of the production of the Chipotle restaurant chain. Namely, the former factor represented the number of consumers who were willing to purchase meals at Chipotle that declined due to the decreased food safety of the restaurants; and the latter factor stood for the input price that it took Chipotle to prepare their products (to be more precise, the growing cost of avocados made the chain increase their prices to cover the unexpected expenses).
Further, one of the factors mentioned above will be selected in order to demonstrate the relationship between the demand and supply aspects resulting from it. The factor chosen for this analysis is the quantity and price of avocados. Since Chipotle is known to serve a variety of foods that include avocados as a key ingredient, the quantity of fruit the chain goes through every day is very large. Moreover, the product cannot be replaced by any other foods because avocado is a unique fruit, and the basis of such menu items sold by Chipotle as guacamole, avocado salad dressing, avocado salsa, and cheddar broiled avocado halves, to name a few.
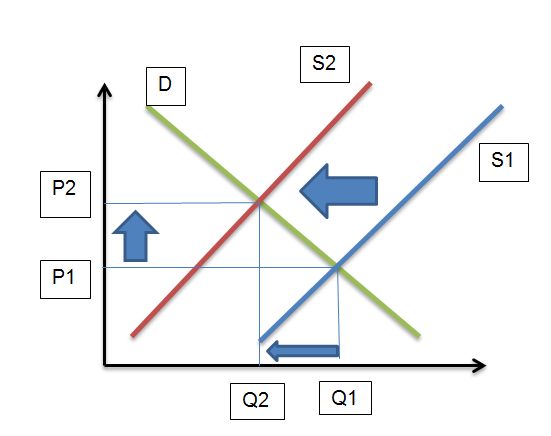
As a result, as demonstrated in Figure 3, the decrease in the quantity of the available avocados (Q1 shifted to the left and creating Q2) made the supply curve shift to the left (S1 shifted to S2). However, it is important to mention that this particular factor did not contribute to any changes in the demand for the production of Chipotle restaurants; and that is why the demand curve (labeled D) remains unchanged. In that way, as both of the supply curves cross with the demand curve, it is possible to see the change in prices. To be more precise, P1, lower under the circumstances of S1, grew when the supply curve shifted to the left and created P2—a higher price (the growth of price is reflected by the arrow pointing upward).

References
6 Supply Shifter Factors. (n.d.) Web.
Stearn, D. (2016). Chipotle E. coli O26 outbreak sickens 60 in 14 states. Web.
Stock, K. (2016). Chipotle’s sales have dropped by 10.3 million burritos. Web.
Weiss, S. R. (2016). What do rising avocado costs mean for your next Chipotle order? Web.