System to Measure the Project Performance Using Earned Value Technique
Following are the phases of a successful implementation of Earned Value Technique in the construction of High Rise Building:
Phase 1: Developing Work Breakdown Structure (WBS)
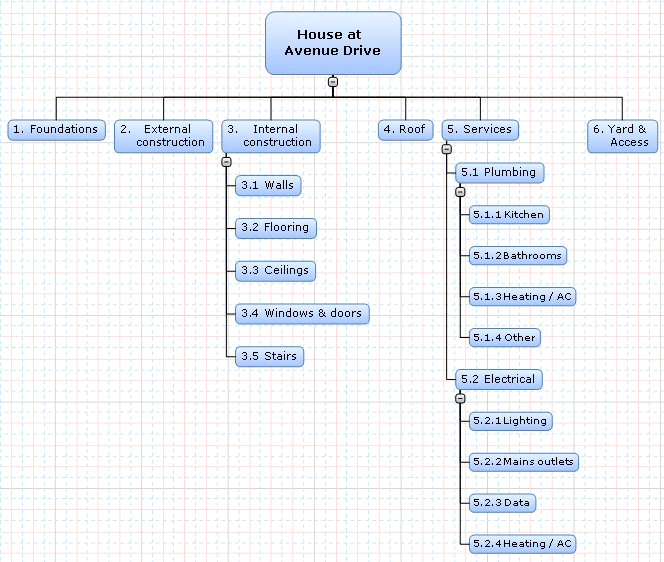
The earned values techniques are more effective if the large project is divided into small workable and manageable segments of the project. These segments are figuratively expressed in a way similar to organization chart form. In high-rise building construction the whole building is divided into segments of floors. Then each floor is further divided into works like slab pouring, column erection, electrification, plumbing, floor, etc. The WBS should be developed to such a level to which the earned value performance management tactics can be incorporated. The finalization of the WBS for the application of EVPM techniques is a critical one as a small level of WBS may lead to excessive data and a higher level may lead to the concealment of very important facts. If we consult different views of experts, it is revealed that the WBS is composed of three to four levels to get precise data for the smooth operation of the EVPM system. Rarely, where the projects are complex, the WBS is composed of five to six levels.

Phase 2: Assign the Tasks
When step one is completed than next step that follows is the assignment of responsibility. As the project is divided into a number of relatively smaller segments, then these segments are given to the project personal. All well-settled organization throughout the world has an organization chart which is a pictorial description of the hierarchy of the organization. It also helps in determining that which individual is responsible for which department and how many staff are being supervised by that specific individual. Responsibility Matrix for every project is developed in order to make sure that the project activities are executed in a properly managed way and there is no conflict of job among the personal. Through this matrix, the responsible worker can be held responsible for any kind of defective work which was executed under his responsibility. Therefore the responsibility matrix also ascertains the quality control of the project. Responsibility Matrix plays a vital role as it is helpful in determining the level of responsibility of the people involved in the project who is responsible for the completion of the project.
Phase 3: Project Planning and Scheduling
Planning is one of the most important and critical parts of the project. With a smart plane targets can be achieved well before time and at the same time if the project is poorly planned then there are chances that the project may get late and accordingly, makes one liable for a penalty which is undesirable in projects such as high-rise building. Once the tasks are assigned then a work schedule is devised which gives complete information about the duration, tasks, important targets, and precedence of jobs involved in activities. For high-rise building construction projects, the job duration in the EVPM system is two to four weeks, however, sometimes this varies according to the requirement. Jobs and targets are associated with habituation, to make a schedule of such a form through which critical activities and critical paths can be identified and free time can be identified for every task and target. Combining the tasks with beginning and end targets proves beneficial in developing a closed working grid.
Phase 4: Devising a Time-Phased Budget
Bill of Quantities, BOQ’s and rate lists may be used for pricing. If possible, to impact the making of the Work Breakdown Structure, it is very beneficial to highlight how the cost schedule will show the schedule. The entire fund allocation for completion of the task, a portion of WBS, or the whole project is called Budget at Completion (BAC).
Phase 5: Objective Measure of Performance
The intended criterion of the achievement mainly relies on the works involved in the task, extent of task and time required to complete the task. As such there are no set standard techniques; however, mostly the approach of targets/ milestones is incorporated. Earned Value, EV, is only asserted when target a target is achieved and the target activities are accomplished. Another method is representing the work in terms of percentage completed. This term is used for achieved Vs planned progress when the target measurement of percentage accomplishment of task is feasible. The indexes of measurement of progress are planned with recurrence to ensure the precise measurement of performance. Different project management tools prove beneficial if incorporated in the project as they facilitate the updating of the progress with time but also help in tracking tasks that are completed, tasks that are currently executed, tasks that are critical and other information of similar nature. The building activities can be expressed in a coded form or through the description and a work schedule can be developed which will give information about which activities are lagging and which activities are ahead of the planned progress. Through such techniques, one can also crash the number of days if any urgency arises. Such techniques are also incorporated when there is a bonus for early completion or when projects are of important nature.
Phase 6: Setting out the Performance Baseline
A logical reference point needs to be developed and should appear logical when brought in comparison to the at-hand resources. The S-curve graph which is interpolated with funds against time is an easy way to evaluate. Investigation reveals that the S-graph for cash flow if properly developed can be accurate up to 88 to 99%. (Howes, 2000)
Phase 7: Observe, Report and Take Action
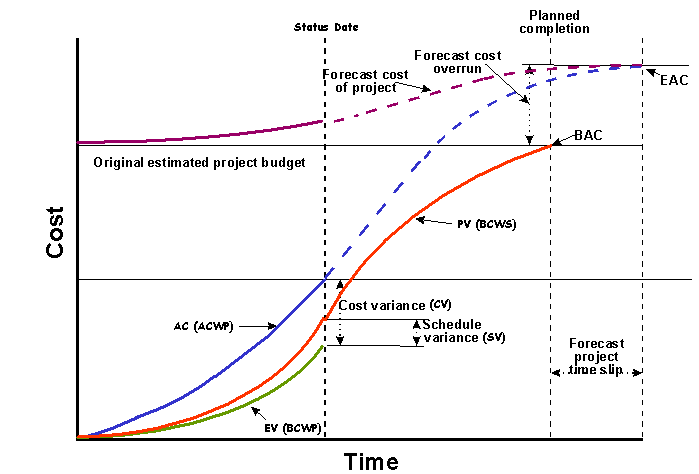
A precisely defined and assessed work plan is mandatory for achieving satisfactory performance standards. With time, as the project progresses and on-site details are gathered from time to time from the site staff, evaluation is done to know if the project being executed is according to the plan prepared. For data collection for determining the actual cost information and deviations, Labor Return Performa and financial reports are used. All the data collected is then given as input to the EVPM system which then determines the Key Performance Indicators (KPI’s), like Schedule Performance Indicator (SPI), Cost Performance Indicator (CPI), Schedule Variance (SV= EV – PV) and Cost Variance (CV= EV – AC). The same is described in the figure below in a very clear way. When the EVPM generates a report then actions in the better interest of the projects are taken. When the work is trackable and documentary formalities are completed then a new reference point is devised. (Raby, 2000)

Earned value of project performance is well capable of measuring the works done against the works planned separately for every segment of the work. Therefore the implementation of such tools and techniques makes the project more planned and manageable with a little effort.
References
Howes,R. (2000). Improving the performance of Earned Value Analysis as a construction project management tool. Engineering, Construction and Architectural Management. 7 (4), 399-411
Raby,M. (2000). Project Management via Earned Value. Work-Study. 49 (1), 6-9