Introduction
The present report aims at describing the project plan for a modernized annual report for a national not-for-profit medical research center that does research on diseases related to aging. The report was commissioned by the board of directors to ensure that the company stays in line with other large non-profit organizations to compete for grants and donations. The primary goal of the annual report’s change in design is to make it comprehendible and attractive for all stakeholders. The new format of the annual report is expected to help to inform the stakeholders about the advances of the medical research and attract new donations and investments.
The present paper identifies the project’s main objective, develops a work breakdown structure (WBS), prepares a list of activities that need to be performed, estimates the duration of each activity, provides a network diagram and calculates the critical path of the project.
Main Objective
A clear statement of the main objective is crucial for the success of the project. According to Pinto (2021), goals provide a clear direction to which a project needs to head. Additionally, goals motivate to keep going even if the conditions are unfavorable (PMBOK Guide, 2017). Thus, the primary objective of the project needs to be both clear and inspiring. The primary objective is different from the final product of the project; however, it needs to be measurable to evaluate the success. Considering all the characteristics mentioned above, the main objective of the presented project is:
Improve the practices of informing stakeholders about the advances in research and fiscal management by altering the format of annual reports of the organization.
Work Breakdown Structure
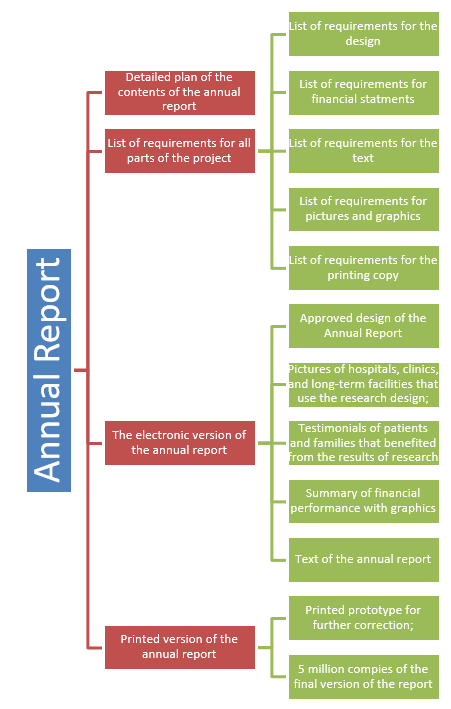
Creating a WBS is a process of subdividing a project into a list of deliverables. WBS also helps to break work into manageable components (Buah, 2021). The WBS provided in Figure 1 below provides a structured vision of the project based on deliverables.

List of Activities
The list of activities helps to determine what actions need to be performed to deliver the objects provided in the WBS. The list of required activities is provided below.
- Prepare a detailed plan of contents of the annual report;
- Create a list of requirements for the design;
- Create a list of requirements for the text of the report;
- Create a list of requirements for the financial statements;
- Create a list of requirements for the pictures and graphics;
- Create a list of requirements for the printed copy of the report;
- Finalize the list of requirements for all the parts of the report;
- Find possible contractors to bid on the design of the report;
- Select the most appropriate design concept according to the main objective and the list of requirements;
- Gather testimonials from of patients and families that benefited from the results of research;
- Prepare the financial report with appropriate graphics according to the list of requirements;
- Write the text based on of the Annual report based on the list of requirements;
- Make the pictures of hospitals, clinics, and long-term care facilities that are using the results of the center’s research.
- Prepare an electronic copy of the annual report;
- Edit and finalize the annual report;
- Find possible contractors for printing the annual report;
- Select the most appropriate contractor based on the requirements;
- Print and edit the prototype of the report;
- Print 5 million copies of the report.
Network Diagram
The network diagram is a bird’s-eye view of the project that helps to understand the sequence of all the activities (Pinto, 2021). The network diagram provided in Figure 2 was created using Microsoft Excel 2016. The network diagram was made assuming that the lists of requirements for a different aspect of the annual report will be created by different people. Additionally, it was assumed that the text could be written only when the financial statements are ready, as the text will depend on the financial performance results. It should be noted that Figure 2 does not show the final version of the diagram, as it does not include the duration, early start (ES), early finish (EF), a late start (LS), late finish (LF), and slack (SL).

Estimations of Duration
In order to understand the duration of the entire project, it is critical to estimate the duration of every activity, taking into consideration the available resources and identify the critical path of the project. Table 1 below estimates the number of days needed to accomplish all the listed activities.
Table 1. Duration estimation by Activity.
Calculations
Table 2 below provides calculations for ES, EF, LS, LF, and SL for all the activities.
Table 2. Calculations.
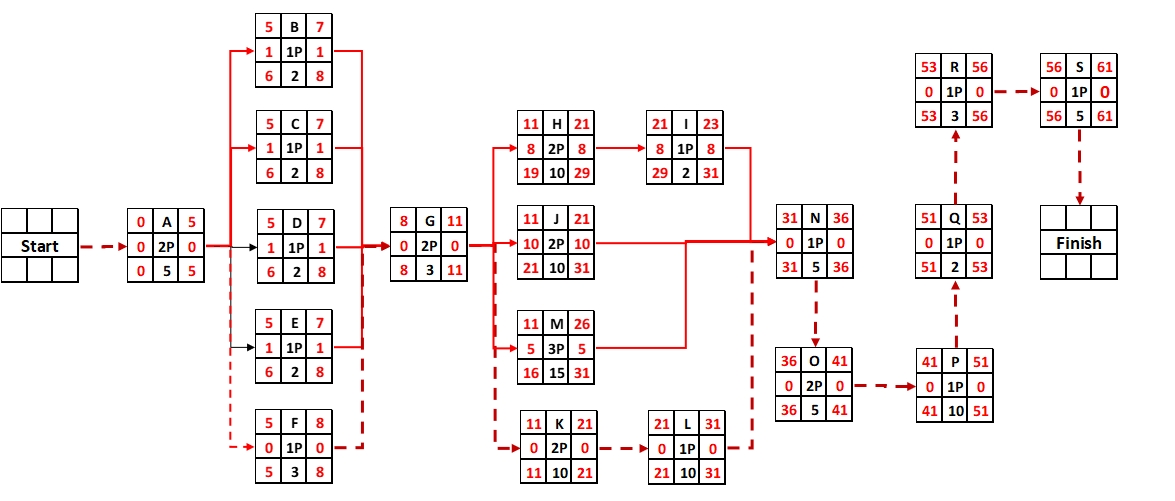
The calculations demonstrate that the project is estimated to take 61 days in total.
Critical Path
A critical path is a sequence of activities that determines the minimal time needed to finish a project. Identifying the critical path is crucial during the planning phase, as it determines the crucial deadlines (Pinto, 2021). The critical path is calculated by determining the slack time of every activity. A sequence of activities with the slack equal to zero is the critical path of the project. According to calculations provided in Table 2, the critical bath is the following:
The activities included critical path is indicated with dark red dashed line in Figure 3, which represents the completed network diagram for the project.

Project Schedule
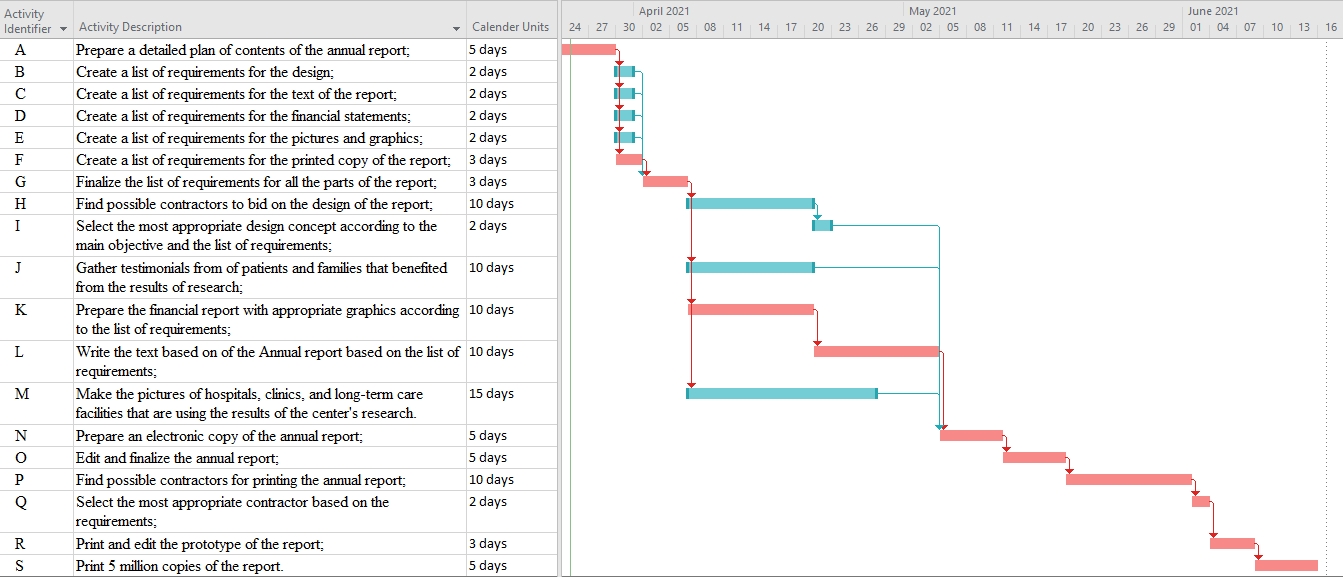
Project schedule with the estimation of needed resources is provided in Table 3 on Page 8 of the present report. Figure 4 on Page 9 visualizes the schedule.


Reference
Buah, S. (2021). The non-project manager’s guide to project management. Grosvenor House Publishing.
Pinto, J. (2021). Project management: Achieving competitive advantage. Pearson.
PMBOK Guide. (2017). A guide to the project management body of knowledge (6th ed.). Project Management Institute.