Introduction/Executive summary
This report involves the statistical analysis of data obtained from the previous jobs conducted by the Allrepairs staff. The performance of individual staff members is evaluated for all the jobs they undertake in terms of the time taken. In conducting this analysis, constraints such as the difficulty of the job are considered alongside the satisfaction of the customer.
The other factor put into consideration is the number of years that the individual has been in the field, and this is important in determining their level of expertise. These values are independent random variables obtained by coding the raw data obtained during the data collection stage and is shown by the table provided.
This analysis is supposed to show the competence of the individual staff members, who collectively determine the credibility of the company. In order to come up with this analysis the hypothesis has to first be determined then tested using the available data. This data will then be evaluated using E-views software which will generate the relevant statistics to be analyzed.
Hypothesis
This analysis is aimed at establishing the credibility of Allrepairs staff members in relation to their experience, job difficulty, the time taken to complete the tasks and the customer’s response. The null hypothesis states that the staff members are not equally competent while the alternative hypothesis states that they have the same level of competence. In case the null hypothesis holds, the alternative hypothesis is automatically disregarded and vice versa.
Data Analysis
The first table in this analysis is a representation of the general statistics of the data objects. It indicates the mean, median, maximum, minimum, standard deviation the skewness and the kurtosis of the individual objects for the 293 observations.
Table 1: descriptive statistics.
From this data, the mean difficulty of the jobs undertaken is below the median, meaning that most jobs are relatively easy. The mean for the satisfaction indicates that most of the customers are satisfied with the job while that of the time taken to complete the tasks indicates that a larger percentage of jobs is completed within the required time frame.
On the years of experience however, the statistics indicate that most of the employees have not been with the company for long, implying a slightly high rate of labor turnover. The standard deviations likewise indicate that the value for the difficulty level is not very deviant from the mean.
This could be interpreted as the jobs have a difficulty level that is relatively similar to each other. As for the level of customer satisfaction, the standard deviation indicates that a majority of the customers approve the services offered to them.
The time and number of year’s deviations, as well, indicate little deviation from the mean. To analyze the interrelationship between any two given objects, we will use the covariance matrix generated as follows.
Table 2: Covariance matrix.
The significance of this is in the determination of how the variables change in relation to each other. The level of difficulty and the satisfaction of the customer seem to be changing in the same direction, implying a proportionate change while that between the mechanic and all the other variables do not change in the same direction.
This means that the result of the repair has nothing to do with the mechanic handling the job. We can therefore conclude that the only variable that does not affect the outcome of the job hence the performance of the company is the mechanic.
The covariance between the number of years in the company and the time taken to complete the tasks has a high covariance and this can be interpreted to mean that the time changes in the same direction with the years of experience.
The next element in this analysis is the determination of individual descriptive statistics alongside the histograms so that we can come up with a conclusion on how the individual variables affect the overall reputation of the company.
First is the difficulty histogram as shown below.
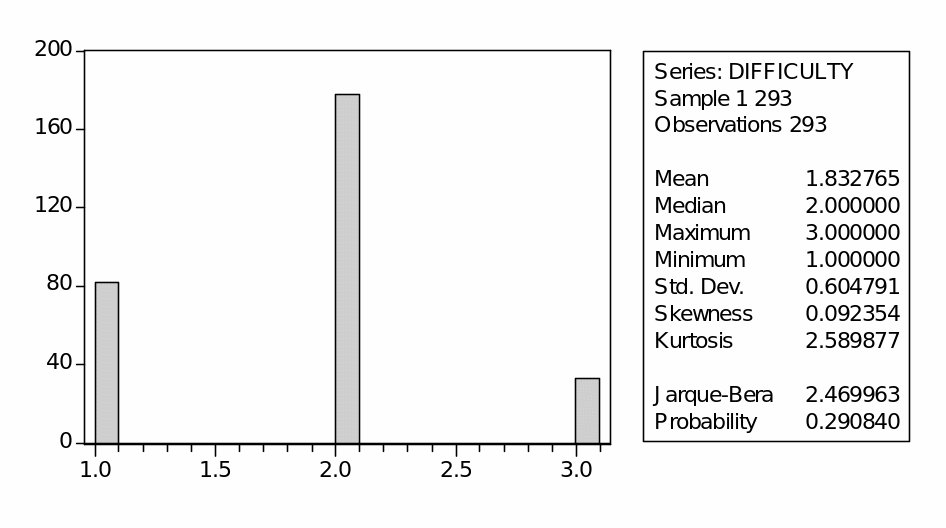
From this histogram, the level of difficulty for the majority of the tasks lies at the average difficulty level. The hardest jobs are the least and this implies that the employees in this company have the necessary expertise to handle the jobs at their disposal. The second diagram is that of the mechanics as shown below.
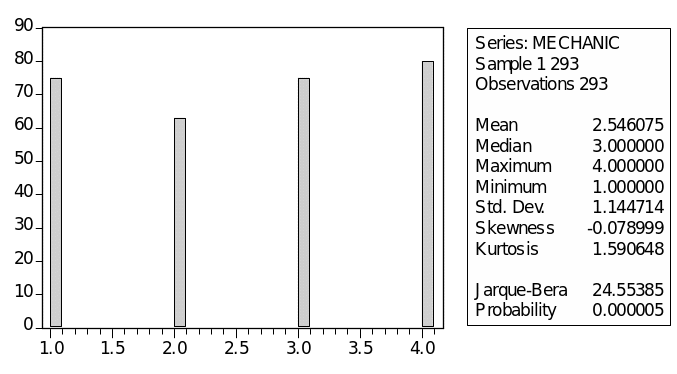
From this, we can conclude that the mechanics do an approximately equal number of jobs as shown by the bars. The difference in the size of the bars is not significant, indicating a fair policy in the company when allocating jobs. Third is the time taken shown in diagram 3 below.
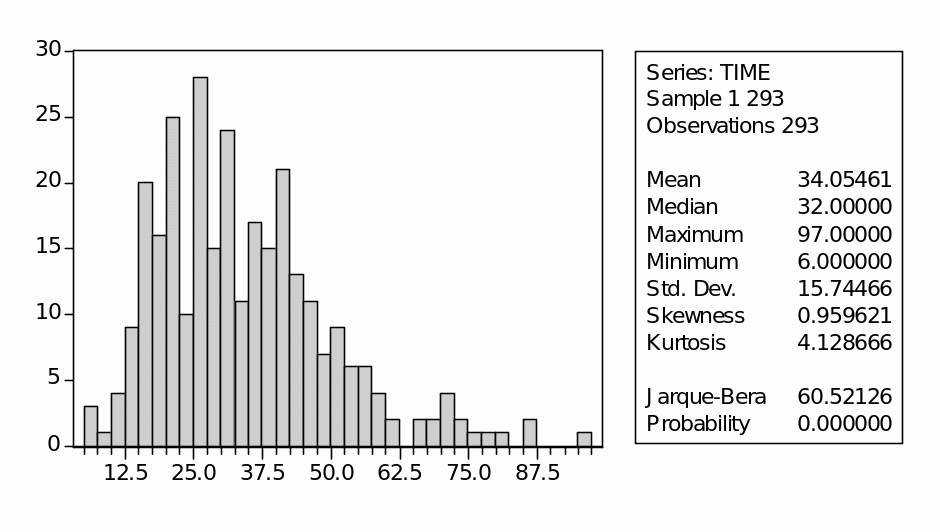
The tasks take different amounts of time to complete depending on the difficulty of the job. Most of the jobs however take a time frame below the average and this is an implication of time efficiency in the company which ensures that completed work is delivered to the customer on time.
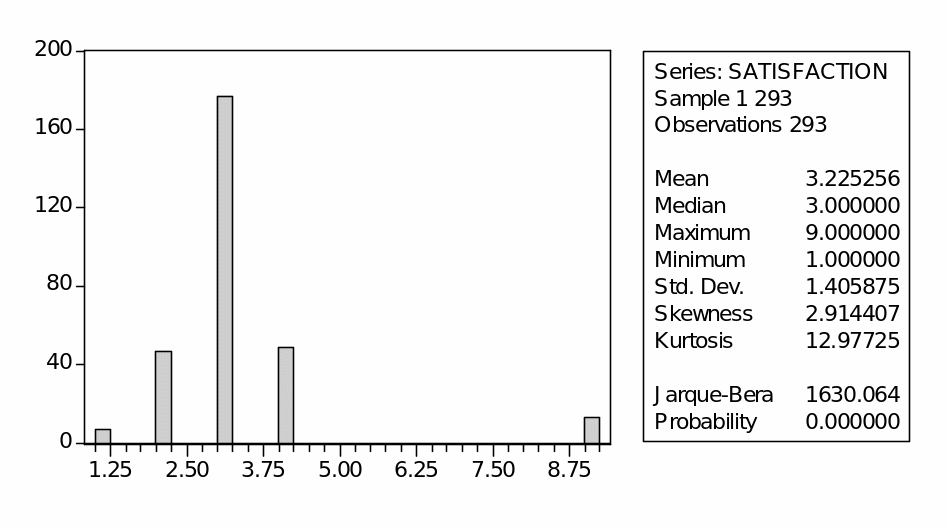
From this diagram, we can conclude that the numbers of customers who have expressed dissatisfaction over the work done are the least. A majority of the observation indicate a high level of satisfaction, which may mean that the repairs done never recurred and they were completed on time.
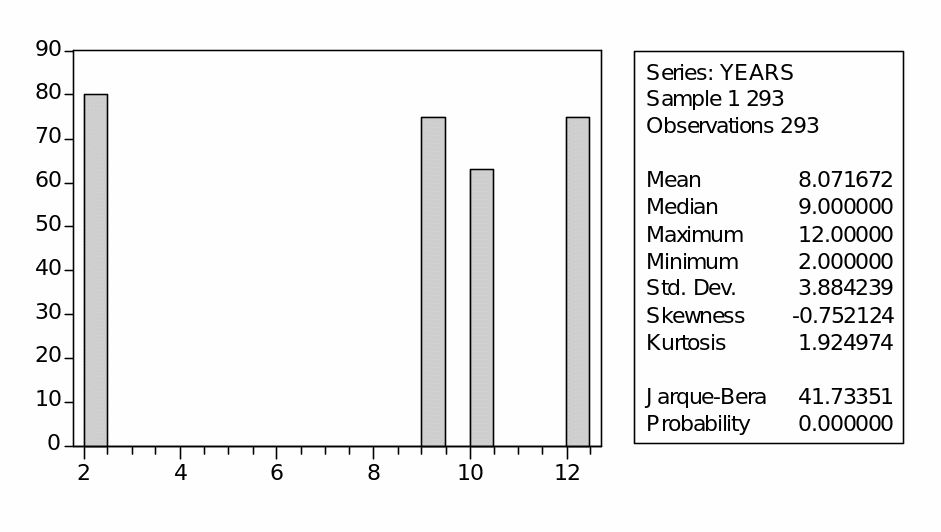
From this diagram, the period of time that the employees have been working in the organization differs greatly, with the gap between the first person and the others being the greatest. This person has however handled the highest number of jobs though by a very small margin compared to the others. The other three seem to have been in the company for an almost equal period of time.
Conclusion
From these diagrams, we can conclude that going with the data provided here, the company is performing effectively and it is credible enough to be hired to carry out repairs. The success of this company can be considered to be as a result of the strong workforce, and so, the alternative hypothesis holds true, disqualifying the null hypothesis.
The employees have an almost equal level of expertise as realized throughout the analysis. The result of the covariance analysis indicates that it does not matter which employee is undertaking the task, since the result is always relatively equal, implying an equal level of expertise among the employees.
References List
Anderson, TW, An Introduction to Multivariate Statistical Analysis, Willey, New York, 1998.
Bowerman, BL, RT O’Connell & ML Hand, Business Statistics in Practice, Mc-Grawhill, Boston, 2001.
Boyle, RG, Descriptive statistics, Victoria College Press, Burwood, 1998.
Bradley, T, Essential Statistics for Economics, Business and Management, John Wiley & Sons, Chichester, 2007.
Dixon, WJ & FJ Massey, Introduction to Statistical Analysis 3d ed, McGraw Hill, New York, 1999.
Doane, DP & LW Seward, Essential statistics in business and Economics, McGraw-Hill Irwin, Boston, 2010.
Edwards, AL, Statistical Analysis 3d ed, Rinehart and Winston, New York, 2009.
Lind, DA, WG Marcal & RD Mason, Statistical techniques in Business and Economics, McGraw-Hill Irvin, Princeton, 2002.
McClave, JT, PG Benson & T Sincich, Statistics for Business and Economics, Prentice Hall, Upper Saddle River, 2001.
Wegner, T, Applied business statistics, 2nd ed, Juta, Cape town, 2007.