Quality management is a realm where decisions should be made based on facts. Modeling of production and management processes in the company becomes possible thanks to a broad range of statistical tools. However, modern statistical tools are rather complicated, and not all participants of the quality management process may understand them. That is why the quality professionals developed a set of seven simple and easily perceivable visual methods of analysis of the processes. Being statistical in their essence and not requiring any special training, those common tools become essential for everyone who deals with quality issues and aims to improve the company’s overall performance.
The set of common quality tools was established by one of the Japanese quality gurus of the new wave, Kaoru Ishikawa, the author of the famous concept of “quality circles”. In 1982, he combined together the existing methods and created his own; those tools were Pareto diagram, cause-and-effect diagram, check sheet, flow chart, run chart, scatter diagram and control chart (Coleman 22). They can be used both to plan and control quality (Hoyle 698). Let us consider each of the tools and find out how they can be used to eliminate defects and streamline the quality management process of the given ice-cream company.
Pareto diagram is based on the analysis of the defects’ frequency. The errors causing defects are then ranked and put in a descending order. It is a very important tool, as the organization’s resources are limited and it is crucial for process owners and stakeholders to understand the root causes of errors (Buser, Massis, and Pollack 67). The diagram is also known as the principle of 80:20, meaning that 80% of all problems is caused by 20% of issues.
Pareto diagram contains columns, which represent individual values in descending order, and a line graph, which stands for a cumulative line (Berger 286). In the given case, Pareto chart can be used to graphically show the rejects that contribute the most to the bad quality of ice cream. From the reject log, we can find out that the defects “soupy” and “ice crystals” are the most frequent and, thus, cause 80% of quality issues. As it is said, that “soupy” refers to the consistency level reached on the fourth step of the process (“Run freeze machine until the consistency is correct”), the company should pay the greatest attention to people and equipment involved at this stage.

Cause-and-effect diagram or Ishikawa diagram helps to visualize the underlying causes of a specific problem. To build this diagram, one needs to define the key elements that influence the quality: Manpower (the personnel involved in the process, stakeholders), Methods (policies, procedures, rules, regulations for the process), Machines (tools and equipment required to perform the work), Materials (raw materials used for the production of the final product), Measurements (data from the process used to evaluate its quality), and Environment (conditions in which the process is carried out) (Dahlgaard, Khanji, and Kristensen 82-84). In the given case study, we can define people (production operators), machines (mixer and freezer), materials (ingredients from the warehouse), and measurements (viscosity data); methods and environment should be clarified to build a complete diagram.
Check sheets can be used both for the control of qualitative and quantitative indicators. This monitoring tool gives a clear picture of defects during the given period (Sanghera 225). The Company’s defect log seems to be very similar to check chart, but it should be modified for a better visual perception of the data. Defect types should be placed in the left vertical column and dates should be placed in the upper row. Total amounts of defects by type and defects by date should be placed in the right vertical column and bottom row respectively.

The flow chart helps to visualize the production process. It uses different types of boxes connected by arrows to show the inputs, actions and outputs of the specific process (Sanghera 224). In the given case, the flow chart will include the steps: pull ingredients from the warehouse, blend ingredients in the mixer, pump mixture to freeze machine, run freeze machine, extrude ice cream into the package, inspect and test ice cream, transfer packages to Finished Good storage.
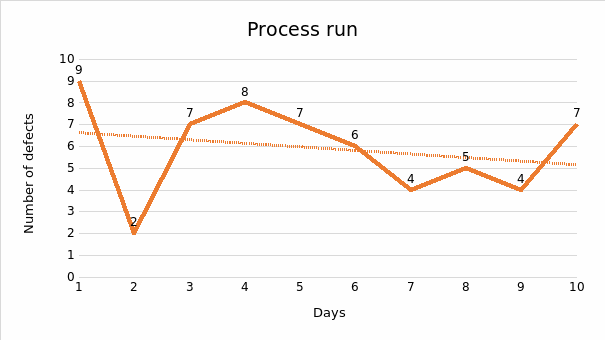
The run chart shows the dynamics of change of variables in a given period. Based on the given data trends of future process development are built. The number of defects can be predicted (Berger 296). For the ice-cream company we can use the total amount of defects during 10-days period and build a trend line.

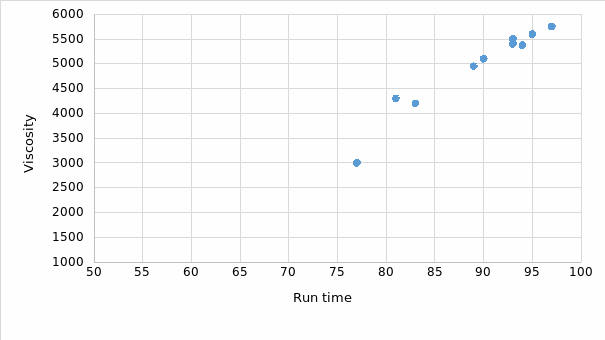
Scatter diagrams are commonly used to depict the relationship between two given pieces of data (Berger 292). Scatter diagram can visually show us the dependence of viscosity on the freezing machine run time.

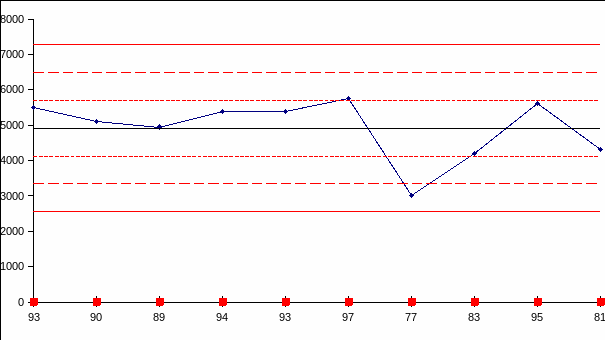
Control card is a chart that depicts the change of variable in terms of limiting quality values (Sanghera 223). Again, the data about the dependence of ice-cream consistency and time in the freezing machine may be used. The limits of quality will be viscosity indicators of 5000 cps and 6000 cps.

Overall, it can be seen that the ice cream company should pay more attention to a selection of the raw materials, mixture and freezing process, which is the most crucial. All the employees of the company must know the quality standards and be responsible for their part of the quality assurance process.
Works Cited
Berger, Roger. The Certified Quality Engineer Handbook. Milwaukee, WI: ASQ Quality Press, 2007. Print.
Buser, Robin, Bruce Massis, and Miriam Pollack. Project Management for Libraries: A Practical Approach. Jefferson, NC: McFarland, 2014. Print.
Coleman, Shirley. Statistical Practice in Business and Industry. Chichester, England: John Wiley & Sons, 2008. Print.
Dahlgaard, Jens, Ghopal Khanji, and Kai Kristensen. Fundamentals of Total Quality Management. New York, NY: Routledge, 2008. Print.
Hoyle, David. ISO 9000 Quality Systems Handbook: Using the Standards as a Framework for Business Improvement. New York, NY: Routledge, 2009. Print.
Sanghera, Paul. Fundamentals of Effective Program Management: A Process Approach Based on the Global Standard. Fort Lauderdale, FL: J. Ross Publishing, 2008. Print.