Introduction
In quantity management practices, firms employ various quality management tools and techniques. Examples of these tools are cause and effect diagrams, histograms, check sheets and so on (The 7 Basic Quality Tools For Process Improvement, 2015). Companies usually use different combinations of these techniques. The choice of the combination is dictated by the companies’ goals, culture and needs.
DHL’s History
DHL is the world’s leading company in freight services and it operates in more than 220 countries. Larry Hillbom, Adrian Dalsey, and Robert Lynn founded DHL in 1969. DHL is the initialism consisting of the first letters of these names. The following decades saw a continuous growth that involved establishment of numerous DHL branches around the world (History, 2015).
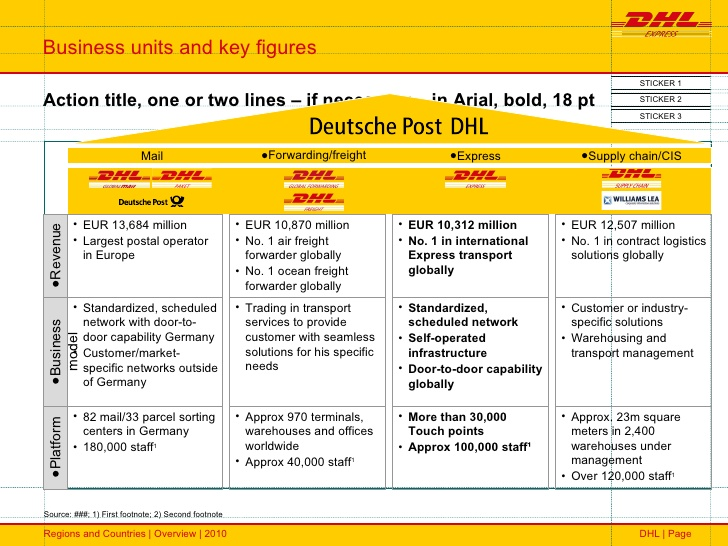
The services that DHL offers focus on the third party logistics. Some of the services provided are transportation management, warehouse storage and inventory management. It delivers parcels by air, rail and road (Camila, 2010). The four primary products of DHL are mail, freight, express service and supply chain/CIS (see fig. 1).
Quality Management Tools and Techniques used by DHL
Flow Charts at DHL
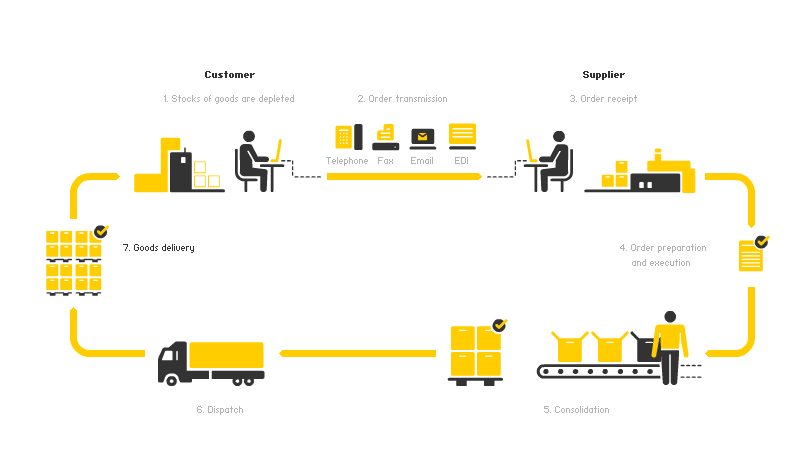
Three quality management tools and techniques used by DHL are considered in this paper: flow charts, brainstorming, and productivity improvement. Flow charts are diagrams that show the flow and nature of steps in a process. For instance, a workflow chart shows the flow of tasks and information when processing a package delivery. Below is one of the flow charts employed by DHL (see fig. 2). Flow charts are used by DHL to promote the understanding of a particular process. Customers benefit from the use of flow charts as they better understand the supply chain of DHL. DHL uses the flow charts as tools for managing the supply chain.
The Workflow at DHL
Hence, it is possible to take a closer look at the workflow at DHL with the help of the workflow chart provided below. The order is seen as the basis of the information flow. It is necessary to note that order processing consists of six main stages. The initial stage is order transmission (Information flow from the order to delivery, 2015). The following technologies are used to accomplish this stage: telephone, mail and e-mail, fax, electronic data exchange. In other words, this is the phase when the order is placed by the customer.
Preparation stage involves adjustment of the order to internal DHL requirements. Clearly, customers often provide quite limited information that is not enough for high-quality delivery of services. Therefore, the company’s employees elicit the missing information; check all the conditions (delivery, pricing and so on), the customer’s creditworthiness, and the capacity of the warehouse.
Routing is the next phase and it involves confirmation of the order for the customer as well as development of internal job orders. The latter can be provided in the manual, electronic or mechanical way. The created delivery notification that is the note for the storage point to start the shipment process. At present, this is an automated process and it does not require much time, which is crucial for the company that tries to provide the delivery services within the shortest time possible.
Routing is followed by picking that involves choosing orders that will be delivered at certain periods. Employees choose the orders in accordance with urgency, their size, time of delivery. This information is provided to the inventory and warehouse as these facilities may need to complete specific tasks and use some equipment.
Preparation is the next stage that ensures effectiveness of the information flow. Preparation of shipping documents involves choosing the most efficient transportation and delivery route.
Finally, invoicing is another stage that requires special attention. This phase can be completed at the beginning or at the end of the entire process. Notably, pre-invoicing is most desirable as the major amount of paperwork can be completed during one stage.
The information flow translates into an efficient delivery process that includes placing of the order, order transmission and order receipt, order preparation and execution, consolidation, dispatch and the delivery proper. It is important to note that each year the company comes up with new innovative technologies used to improve the quality of services provided as well as efficiency of procedures.
Brainstorming as a Quality Control Tool at DHL
Brainstorming is a technique used by organisations to improve their quality management practice. It involves development of solutions to a defined problem the company is facing. After suggestions have been received, they are then discussed to establish their values. Brainstorming is used when many options are desired (The 7 Basic Quality Tools For Process Improvement, 2015).
The results of such brainstorming are used to develop a service delivery system that is aligned to the customer’s behaviour (Coltman, 2010). Hence with the help of brainstorming, DHL has improved service delivery, customer satisfaction, and customer retention rates.
Productivity Improvement as a Quality Management Tool in DHL
DHL uses productivity improvement as a tool for improving its processes. DHL introduced its Intraship product as an automation solution for clients during order entry processing (DHL Intraship simplify your shipping process, 2015). After acquiring Airborne Express, DHL planned a complete overhaul of Airborne Express’ accounts payable processes. ImageSource was contracted to improve the accounts payable process. The outcome was an integration of the accounts payable process with the Oracle 11 system (DHL/Airborne Express implements SAP-certified archive, 2012).
The introduction of Intraship helped DHL to improve visibility of the supply chain. Errors related to data entry reduced significantly (DHL Intraship simplify your shipping process, 2015). Improvement of accounts payable processes by ImageSource eased access to data and eliminated data double entry.
DHL Quality Philosophies
Being the user of a total quality management (TQM) approach, DHL employs the quality philosophies associated with TQM. The application of TQM, vision statement, mission statement, customer satisfaction policy and the seven corporate values used by DHL are the quality philosophies that DHL uses. Three of the quality philosophies used by DHL are discussed below.
Customer-Driven Excellence
DHL insists on customer-driven excellence. All products that are offered by DHL are always changed to reflect clients’ needs in the logistics industry (Efficient management of information and goods, 2015). Its vision statement provides evidence of the insistence on customer satisfaction. DHL’s mission statement shows that DHL focuses on enhancing the customer’s businesses. The way DHL aims to improve customer’s businesses is by offering quality logistics services and a worldwide transport network. In addition, the company focuses on having long-term business relationships with the client (Customer satisfaction process, 2008).
Social Responsibility
According to DHL’s seven corporate values, it seeks to create benefits for the communities in which it carries out its operations. Furthermore, it protects the environment in the areas in which it operates. The company goes further and asserts that it respects cultures and values of all countries in which it is present (Customer satisfaction process, 2008).
Valuing Employees and Partners
DHL’s placement of value on its employees is evident when considering the mission statement and DHL’s seven corporate values. According to DHL’s mission statement, the company aims at attracting and retaining the best employees. DHL considers its employees as a vital part of its entrepreneurship efforts. Through its seven corporate values, DHL shows its commitment in rewarding top achievers.
Conclusion
DHL’s insistence on quality is one of the factors that have led its market leadership position. It has incorporated many methods to ensure that its processes and products are of high quality. However, many studies have uncovered a lot of shortcomings in DHL’s operations concerning its quality control. For instance, there was no single statistical tool of quality management that was identified to be currently in use by DHL, and that was the main reason the suggested quality management tools and techniques were mathematical in nature.
One quality management tool that DHL has managed to use effectively is flow chart diagrams. In fact, the first flow chart diagram found in this paper is very detailed to the point that it has included most of its operations processes. The combination of a fishbone diagram, check sheets, and Pareto diagrams is a good fit. Check sheets are data collection tools. Fishbone diagrams help in the identification and correction of flaws in the process. Pareto diagrams help a company to prioritise its efforts.
Recommendations
As seen from the analysis of DHL’s operations, the organisation has managed to develop an efficient set of procedures to ensure the highest quality of services provided. At the same time, it is possible to offer a number of measures the company may undertake to improve the existing procedures. In the first place, it is necessary to note that these innovations will be mathematical in nature.
This will ensure precision, error avoidance and reduction of time needed to complete certain procedures. For instance, one of the strategies to be utilised is the critical analysis path. Clearly, it is also important to make sure that computer-based technology will facilitate efficiency of procedures. It is crucial to introduce specific applications that will enable employees to use the techniques mentioned in this section.
Critical Path Analysis
A critical path is referred to as the way to do a process in the shortest time (Baker, 2013). The shortest path in performing DHL’s package delivery will be based on the major stages of the delivery process. Those functions that are included in the critical path are those that cannot be delayed without affecting the package delivery process. DHL will identify activities that are critical and not critical in any of its processes by establishing earliest start times and earliest finishing times. Using the workflow for packages delivery, DHL can create critical paths for various goods delivery processes (see table 1).
Table 1: A critical path method implementation
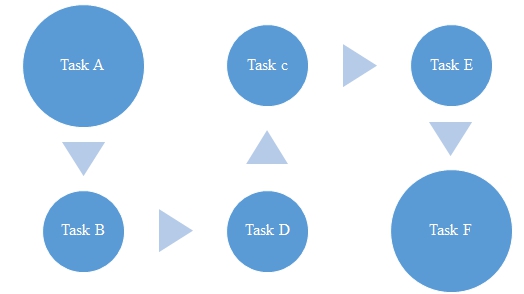
It is recommended that DHL should calculate all the necessary time spans for every task so that a critical path analysis can be performed. A critical path will then be identified and fitted (see fig. 3). The critical path analysis is especially recommended for delivery processes that may prove to be problematic. Thus, it is necessary to identify major types of orders/goods. For instance, there can be a group of urgent small parcels, the group of massive goods, the group of non-urgent small parcels and so on. The employees should analyse each of these groups using the critical path approach and the table provided. There are high chances that it will be possible to get rid of superfluous and inefficient processes.
For instance, the stages of routing and preparation can be combined, which will lead to the more efficient use of time. Of course, it is important to apply the approach to all major groups of orders, as there can be differences that occur due to peculiarities of the goods delivered or conditions of delivery. It is also beneficial to use certain software to make sure that the analysis is error-free and that it will require minimum time.
Cause-Effect Diagrams
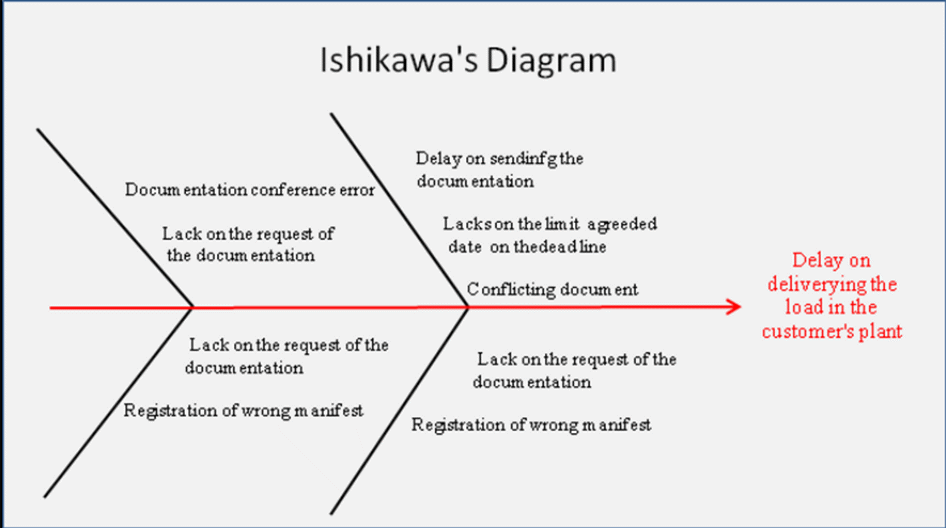
Another recommendation that can significantly improve operations at DHL is the use of such tools as cause-effect diagrams, check sheets and Pareto charts. These tools will help to identify particular imperfections and flaws in procedures. The cause-effect diagram that would be ideal for DHL is a fishbone diagram. Fishbone diagrams are also referred to as Ishikawa diagrams. The fishbone diagram helps to identify causes of problems or inefficiencies in an individual process (The 7 Basic Quality Tools For Process Improvement, 2015).
Since DHL’s primary product is package delivery service, the fishbone should deal with the process of service delivery. To construct a fishbone diagram one needs to categorise the causes of the particular outcome into four main categories. These categories are people, process, machinery, and material. In constructing a fishbone diagram for DHL, one must first identify all the relevant causes that would lead to a delay in package delivery and then categorise them. Camila (2010) uncovered nine reasons that could lead to a delay in DHL’s package delivery service. Below is the resultant fishbone diagram (see fig. 4).
Check Sheets to Be Implemented for Data Collection
The check sheet is a data collection tool. The data collected should have a time series element if data from many check sheets are combined. DHL can use the data collected for analysis of its processes at later dates of particular processes. The check sheet should be a complementary tool to the fishbone. It will help to identify particular errors that occur and the way they affect efficiency of the processes and procedures. There can be nine errors that cause delays in package deliveries that can be used to create a check sheet (see table 2).
The types of errors mentioned are the most common for a delivery service company and are quite common at DHL.
Key
Type 1 – Documentation conference error
Type 2 – Lack on the request of the documentation
Type 3 – Delay on sending documentation
Type 4 – Document fails to meet deadline
Type 5 – Conflicting document
Type 6 – Lack of the request of the documentation
Type 7 – Registration of wrong manifest
Type 8 – Registration of wrong manifest (affecting material)
Type 9 – Lack of the request of the documentation (concerning materials)
Pareto Charts
Pareto charts are bar charts that are arranged in the descending order from left to right. The charts are based on the ideology that 20% of the factors of an individual process are responsible for 80% of the effects. By using Pareto charts, it is possible to separate the ‘trivial many’ from the ‘vital few’ (The 7 Basic Quality Tools For Process Improvement, 2015).
In other words, this technique will help the employees to identify the most serious and far-reaching errors that occur. This will help to prioritise and come up with effective solutions to existing issues. More so, it will also help identify customers’ needs and the level of their satisfaction as the company will define particular effects of specific services provided.
DHL can use Pareto charts for many of its processes especially in warehousing. For example, DHL can use Pareto charts to analyse the proportions of its deliveries across different periods. Below is an example of a possible Pareto chart that DHL could use (see fig. 5).
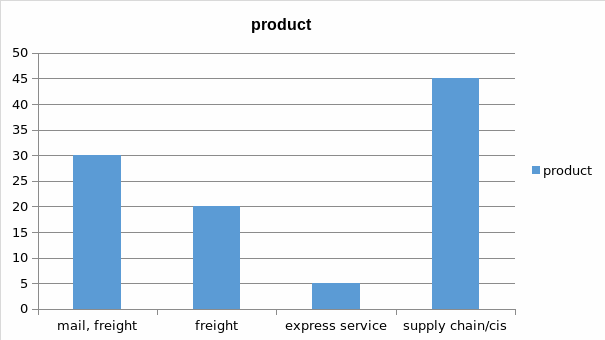
As the model chart shows, DHL would be in a good position to know which product is responsible for bringing in the majority of new users. Such information would then affect how DHL would design its product promotion activities.
References
Baker, S.L. (2013). Critical path method (CPM).
Camila, G. K. (2010). Organizational culture by change management: DHL global forwarding case study.
Coltman, J.G. (2010). Realigning service operations strategy at DHL Express. Research Online, 40(3), 175-183.
Customer satisfaction process. (2008).
DHL/Airborne Express implements SAP-certified archive, workflow and retrieval solution for AP. (2012).
DHL Intraship simplify your shipping process. (2015).
Efficient management of information and goods. (2015).
History. (2015).
Information flow from the order to delivery. (2015).