Introduction
Background, Research Problem, and Research Question
The aim of this report is to conduct consultancy research which will concentrate on how to expand the digital markets and increase its online presence. Eco-Chocolate is a UK based organic and ethically sourced chocolate desserts brand that opened its first physical store in 2018, generating loyal customers. Even though it has been successful during the past three years, the company started to feel the need for further expansion. The company’s current goal is to attract new target audiences from France and UK using web-based resources.
Even though the company is determined to gain a presence in online markets, it is unaware of possible opportunities and risks of entering online commerce, which is the main research problem. The present research aims at addressing the problem by conducting an overview of current trends and digital markets and conducting a literature review on possible pitfalls and benefits of expansion to digital markets.
The research question is:
RQ1: How does Eco-Chocolate demonstrate its digital brand awareness while maintaining its current customers and gaining new ones within the sustainability approach?
Business Secondary Research
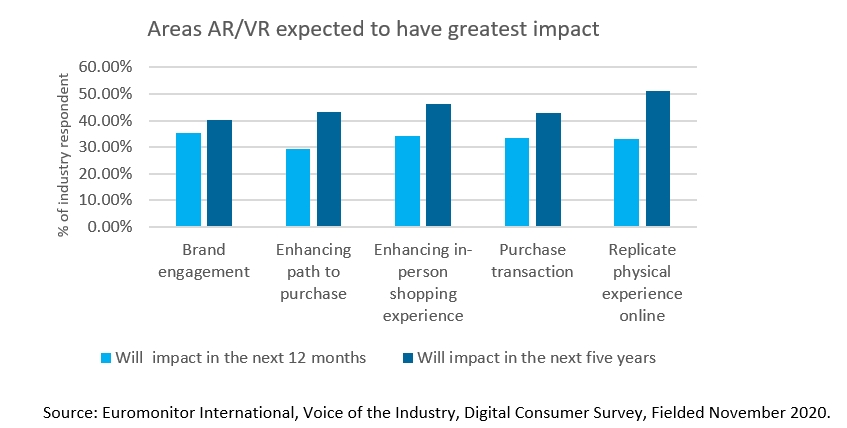
Digital transformation helps businesses to provide a more efficient experience for customers and becomes very beneficial for acquiring a competitive advantage (Laster, 2021). Digital transformation is the process of integrating digital technology into all aspects of an organisation in order to improve and create new operational processes while also providing greater value to consumers. It symbolises a cultural movement toward more agile and intelligent corporate practices, aided by sophisticated analytics and artificial intelligence technology (AI) (Liu, 2021). With the use of the right digital tools, “Eco-Chocolate” should become innovative and driven. As the industry has been driven into the digital era, innovation has been key in becoming a successful company. Figure 1 below demonstrates how AR and VR technologies are expected to affect marketing in the nearest future.

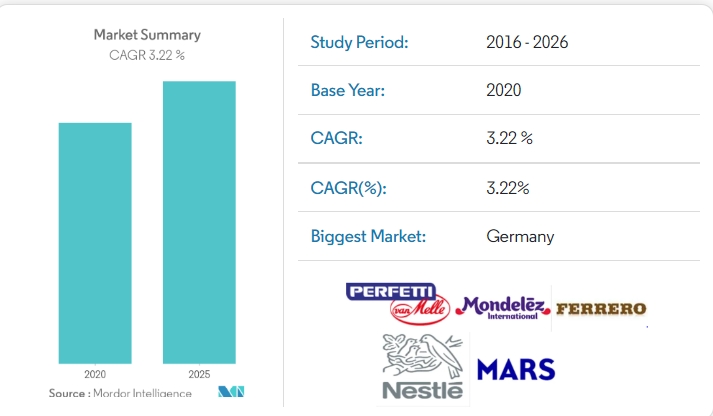
The pandemic increased online purchase behaviour, which made it imperative for businesses to move online (Nealon, 2021). Moreover, it is currently a favourable time to expand to new confectionary markets, as the confectionery industry in UE is expected to grow at a CAGR of 3.22 % between 2021 and 2026 (Mordor Intelligence, 2021). Moreover, the demand for high-quality chocolate is rising, which is favourable for Eco-Chocolate (Mordor Intelligence, 2021). Since the largest market in Europe is currently Germany, it is recommended to expand to Germany first (Mordor Intelligence, 2021). Figure 2 below demonstrates a snapshot of the industry.

However, before expanding to other markets and starting selling online, it is recommended first to learn how to serve the current customers the best way (Napoletano, 2020). Before starting selling online, the company needs to establish its image in the digital space, which needs to include setting up a corporate website and building a strong community in social media (Napoletano, 2020). Additionally, the company needs to make sure that the business can be found online, which implies setting up online a marketing campaign through promotion packages (Pascaretta, 2021). Moreover, it would be appropriate for the company to set up chatbots to ensure customer satisfaction (Chahal and Tesseras, 2017). Suing the above-mentioned techniques will ensure the successful digitisation of Eco-Chocolate.
Literature Review on Sustainable Consumption Behaviour
Eco-Chocolate sells organic, ethically sourced chocolate desserts, which implies that it targets customers with sustainable consumption behaviour. Therefore, it is crucial to understand what factors affect sustainable consumption to better understand its customers. The literature review provided in this section overviews several recent scholarly articles that focus on this matter.
Sustainable consumption has been growing in Europe in recent years for several reasons. Saari et al. (2021) explored how environmental awareness and environmental risk perception affected sustainable consumption behaviour. The researchers created a novel conceptual model that demonstrated that there was an indirect link between these three matters. In particular, the research revealed that environmental risk perception and environmental knowledge affected environmental concerns, which in turn affected sustainable consumption behaviour (Saari et al., 2021). In other words, environmental concern plays a mediating role between environmental risk perception and environmental awareness on the one side and sustainable consumption behaviour on the other side. The researchers stated that understanding this model plays a crucial role in the transition to the green and circular economy.
When speaking specifically about purchasing organic foods, Lazaroiu et al. (2019) mentioned several other factors that promote sustainable purchasing behaviour. In particular, the authors mentioned that the key factor that promotes purchases of sustainable foods is the perception of the quality of the products and their nutritional benefits. Additionally, Lazaroiu et al. (2019) state that customers have increased trust in retailers that sell organic foods, which builds positive customer relations. These relations and perceived health benefits encourage customers to pay increased prices on the goods. This knowledge is crucial, as it provides grounds for Eco-Chocolate to build its marketing campaign on.
Love for nature is another factor that promotes sustainable purchase behaviour, according to Dong et al. (2020). The authors proposed that love for nature consists of intimacy with nature, commitment to nature, and passion for nature. Connectedness to nature was found to be the driving factor of the love for nature. Dong et al. (2020) define connectedness to nature as “individuals’ experiential and emotional connections to nature” (p. 4). Connectedness to nature is closely associated with altruism, empathy, and a strong belief in the mystical powers of God and nature. Therefore, Eco-Chocolate can promote its products by developing these qualities in the potential customers.
Kadic-Maglajlic et al. (2019) state that people practice sustainable consumption behaviour not only for environmental reasons. The researchers studied sustainable purchase behaviour among young adults and concluded that people practice such behaviour for social and environmental reasons. In other words, while some people purchase products for responsible sources for love for nature and environmental concerns, others do so because they identify themselves as part of the community that supports sustainable purchasing. Such behaviour may be promoted by customer engagement. Thus, it is crucial for Eco-Chocolate to promote customer engagement to increase sustainable consumption behaviour.
Recommendations
Several recommendations can be given to help Eco-Chocolate expand to online markets. The bulleted list provided below outlines the most important of these recommendations.
- Start with building a community. The company should start with making grounds for future online sales. In particular, the company needs to make its corporate website and invest in social media marketing to increase brand awareness (Napoletano, 2020). These web resources should become easily discovered using online searches through appropriate keywords (Pascaretta, 2021). Having a strong online community and an established marketing campaign will help the company to have a strong basis for further online sales. Additionally, online platforms will allow the company to test its selling and marketing techniques without potential harm to online purchases.
- Act quickly. Even though Eco-Chocolate should commence into selling online immediately, it needs to avoid hesitation. Currently, it is the most favourable time to move businesses online, as the COVID-19 pandemic changed purchasing behaviour to favour online shopping (Nealon, 2021). Moreover, the confectionary industry growth projections are also favourable, especially in the healthy sweets section, which makes it a perfect time to expand the business (Mordor Intelligence, 2021). It is crucial to act quickly, as competitors may be willing to take advantage of the favourable market situation, which will decrease the potential market share of Eco-Chocolate.
- Consider expanding to Germany. Currently, Germany is the largest confectionery market in Europe (Mordor Intelligence, 2021). Expanding to Germany will give Eco-Chocolate access to the largest number of customers in Europe. However, before expanding to another country, it is crucial to test the online sales processes in France and UK, where it currently has its stores.
- Focus on innovation. Successful digitisation is impossible without innovation, which implies that Eco-Chocolate needs to include innovation as one of the central values of the company. Digitisation may include a wide variety of approaches, including chatbots, AI utilisation, AR, and VR purchases (Chahal and Tesseras, 2017; Liu, 2021). However, all the innovative approaches should be implemented only after there is a strong basis in terms of digital community and supply chain.
- Build the new marketing campaign on environmental awareness and connectedness to nature. The review of the literature revealed that environmental awareness, environmental risk perception, and connectedness to nature are the key factors affecting sustainable consumption behaviour (Dong et al., 2020; Saari et al., 2021). Thus, it is crucial for the company to develop strategies that will evoke these emotions in the minds of the customers. Such strategies are expected to lead to increased sales and trust in the company.
- Focus on health benefits. People often purchase organic foods because they trust that the producer uses products rich in nutrients (Lazaroiu et al., 2019). Thus, focusing on the health benefits of the products sold by Eco-Chocolate increase revenues and interest in the brand. Additionally, a marketing campaign based on health benefits will increase trust in the company.
- Ensure Customer Engagement. It is crucial to engage customers in activities associated with the brand, as it increases customer loyalty. As concluded by Kadic-Maglajlic et al. (2019), some people practice sustainable consumption behaviour for social reasons, as they associate themselves with a community that has these habits.
Understanding Current Customers
Purpose of the Section
The purpose of the present section is to help the confectionery understand its current customers. In particular, the report analyses the income levels of customers and how the fact of holding a loyalty card affects the likelihood of recommending the confectionary to a friend. The assessment is expected to help if the company to modify its targeting campaign and understand if the current policy concerning loyalty cards positively affects the probability of customers recommending the company. Additionally, the section aimed at determining how frequency of visits affect likelihood of recommending the company to a friend.
Question 1
First, the present report analysed the income level distribution of the company’s customers. In order to assess the income level of the customer, the present report uses descriptive statistics and a histogram. According to Saunders, Lewis, and Thornhill (2019), descriptive statistics are the best way to overview large samples of data, which is crucial for understanding the customers of the company. Descriptive statistics include measures of central tendency (mean, median, and mode) and dispersion (standard deviation, variation, kurtosis, and skewness). Cooper and Schindler (2014) state that histograms are the most appropriate graphs that can help to visualise large samples of data. They help to visualise how data is distributed along the x-axis (Creswell, 2007). Thus, the selected methods for answering the first questions appear appropriate.
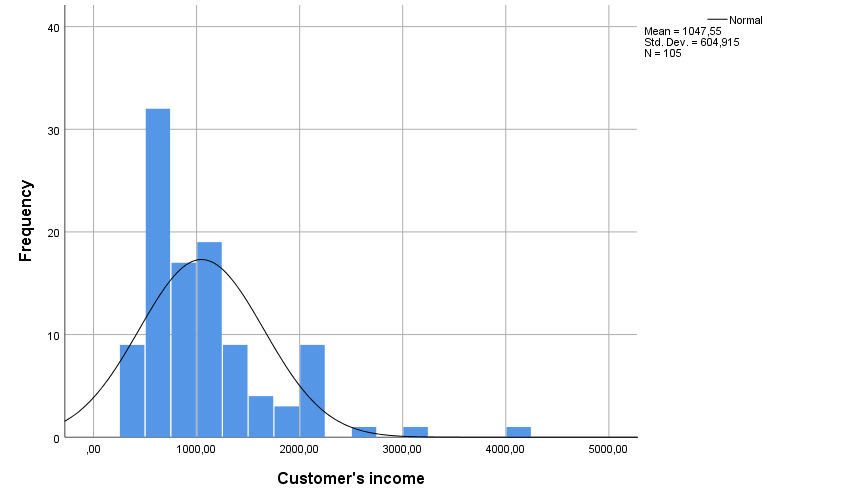
The analysis of the distribution of the customer’s income revealed the income of the company’s customers varied between 350 and 4000. The mean value was 1048, with the true mean of the population lying between 930 and 1165 with a 95% certainty. The standard deviation of the sample was 605, which implies that under the empirical rule, 95% of the customers have income between 0 and 2,258, and 68% of customers have income between 443 and 1,653 (to Saunders, Lewis, and Thornhill, 2019). The data is positively skewed (1.89), which implies that the right tail is longer than the left one. Additionally, the Kurtosis of 5.2 demonstrates that the tails are heavier than in the normal distribution. Descriptive statistics for the sample are provided in Table 1 below.
Table 1. Descriptive statistics of customers’ income.
The data is best visualised using a histogram, which is demonstrated in Figure 3 below. It demonstrates that the majority of surveyed customers reported having income between 500 and 1250. This appears to be the most appropriate segment of customers for targeting the loyalty campaign.

Question 2
The second aspect of the loyalty program that will be analysed is the effect of holding a loyalty card on the likelihood of recommending the confectionary to friends and family. This analysis is expected to help the company understand if the current approach to the loyalty program is effective. In order to achieve this purpose, an independent sample t-test will be used to estimate if the mean likelihood of recommending the company to friends and family differs between customers that hold the loyalty car and those that do not hold the card. Independent sample t-tests are commonly used to measure if the difference in means of two samples are statistically significant (Saunders, Lewis, and Thornhill, 2019). Thus, the analysis methods used to analyse the effect of holding a loyalty card on the likelihood of recommending the confectionary is appropriate.
The analysis revealed that cardholders are more likely to recommend a brand to a friend. The t-test revealed that 59 loyalty cardholders (M = 5.78; SD = 0.77) in comparison with 46 non-cardholders (M = 4.8; SD = 1.24) had a higher likelihood of recommending the brand to a friend t(103) = -5, p < 0.001. Thus, it may be concluded that holding a loyalty card has a significant positive effect on the likelihood of recommending a brand to a friend. Thus, in order to increase the word-of-mouth element of the marketing campaign for the company’s current brands, it is recommended that loyalty cards are distributed among customers.
Table 3. Independent sample t-test statistics.
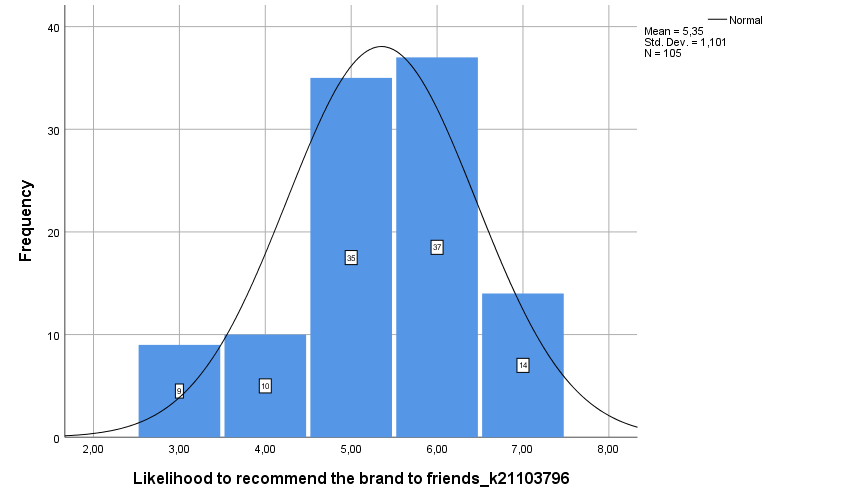
The probability of recommending the Eco-Chocolate to a friend was tested for normality using a histogram (see Figure 4 below). Observations demonstrate that the variable is normally distributed, which allows using t-tests.

Question 3
The third aspect of the present research aimed at creating the best model for predicting the probability of recommending the company to a friend. Two multiple regression analyses were run to determine the most appropriate model, which is considered appropriate according to Creswell (2007). Multiple regression analysis is used to build a model that depicts relationships between one response variable and several independent variables (Wagner, 2019).
The first regression model considered all the assessed variables, including the level on income, frequency of visits, perceived quality of goods, perceived for store location, and holding a loyalty card. In order to run the analysis correctly, frequency of visits was turned into three dummy variables named “Low Frequency of visits,” “Average Frequency of visits,” and “High Frequency of visits.” The model had moderate predictive ability with an adjusted R2 = 0.409. The results for coefficient estimations are provided in Table 4 below.
Table 4. First regression model coefficient estimations.
The results of the first model revealed that holding a loyalty card and convenience of store location were significant predictors of the probability to recommend the company to a friend. All other variables were insignificant predictors. The second model included only these two variables as predictors of the probability to recommend the company to a friend. The model was statistically significant with a higher adjusted coefficient of determination (adjusted R2 = 0.42). The estimations for coefficients are provided in Table 5 below.
Table 5. Second regression model coefficient estimations
The regression analysis was run, as the dependent variable fulfilled all the assumptions, which are normality of distribution (see Figure 4 above), homoscedasticity, and independence of observations. The variables were checked for homoscedasticity using correlation analysis (see Table 6 below). The results revealed that there were no correlations above 0.8, which considered appropriate for regression analysis (Creswell, 2007). If the assumptions were not met, the information provided by the analysis would be misleading (Wagner, 2019).
References
Chahal, M. and Tesseras, L. (2017) How Adidas, Just Eat and HTC are using chatbots. Web.
Cooper, D. R. and Schindler, P. S. (2014) Business research methods. Philippines: McGraw-Hill Education.
Creswell, J.W. (2007) Qualitative inquiry & research design. Thousand Oaks: Sage Publications.
Dong, X. et al. (2020) ‘Love of nature as a mediator between connectedness to nature and sustainable consumption behavior’, Journal of Cleaner Production, 242, article 118451.
Kadic-Maglajlic, S., et al. (2019) ‘Being engaged is a good thing: Understanding sustainable consumption behavior among young adults, Journal of Business Research, 104, pp. 644-654.
Laster, D. (2021) Council Post: Why the Era of Digital Transformation Is Important for Companies of All Sizes. Web.
Lazaroiu, G. et al. (2019) ‘Trust management in organic agriculture: Sustainable consumption behavior, environmentally conscious purchase intention, and healthy food choices’, Frontiers in Public Health, 7, article 340.
Liu, S. (2021) Topic: Digital transformation. Web.
Mordor Intelligence (2021) Europe confectionery market – growth, trends, covid-19 impact, and forecasts (2021 – 2026). Web.
Napoletano, E. (2020) Pivot Your Small Business Online: Tips, Resources and Inspiration. Web.
Nealon, K. (2021) How Covid-19 Changed Retail — Probably Forever. Web.
Pascaretta, J. (2021) Taking Your Small Business Online. Web.
Saari, U. A. et al. (2021) ‘Sustainable consumption behavior of Europeans: The influence of environmental knowledge and risk perception on environmental concern and behavioral intention’, Ecological Economics, 189, article 107155.
Saunders, M. N. K., Lewis, P., and Thornhill, A. (2019) Research methods for business students. Brazil: Pearson.
Wagner, W. (2019). Using IBM® SPSS® statistics for research methods and social science statistics (7th ed.). SAGE Publications.
Yasmeen, R. (2021). Key Technologies Leading Digital Innovation in Commerce During 2020. Forbes. Web.