The Aqua (EOS PM-1) and Terra (EOS AM-1) satellites were launched by NASA in 2002 and 1999 respectively, and each of them contains the MODIS (Moderate-Resolution Imaging Spectroradiometer) sensor. These satellites form a portion of the Earth’s Observing System, or NASA EOS, and work synchronously around the sun while orbiting near the poles of the earth. Up to date, the five-year lifespan Aqua and Terra MODIS sensors obtain high quality data.
Specifically, the MODIS sensor was engineered to assist in global atmospheric research, that is, both in the ocean and on land. With a viewing swath of about 2 330 kilometers, the satellites have the ability of making complete cycles in less than two days. While the Aqua satellite travels from south to north around 1:30 p.m., the Terra satellite moves in the opposite direction about 10:30 a.m. local time (Esaias, 1998, p. 1255).
Accordingly, the two satellites receive data in over 36 spectral bands. The MODIS remote sensor products vary from land, cryosphere, calibration, oceans, and to the atmosphere. Again, the instrument has resolutions of 250m, 500m and 1000m. Additionally, most of the MODIS products and ocean color bands resemble the SeaWiFS, which have a 1000m resolution size. There are various types of ocean color coded channels and their applications as shown in the table below (Morel, 1977, p. 720).
Moreover, MODIS sensors have got several quality water applications. One such application was done in Lake Flathead, Montana. In regard to the general features of the lake, it is 113m deep, covers a total area of 480 km2, and is among the largest naturally occurring freshwater lakes at the moment.
However, this oligotrophic lake underwent rising eutrophication processes in 1977 and 2001. In addition, it experienced two macroalgae lakewide blooms that significantly reduced its water quality as a result of anthropogenic nutrient input. Consequently, when it was surveyed during 2004 and 2005, the results revealed a temperature range that was between 8.3 and 22.60C, Secchi depths between 1.5 and 17 m, and chlorophyll-a levels between 0.1 to 0.9 mg/m3 (Clark et al., 1970, p. 1120).
After that, the researchers used transmissometers and fluorometers to obtain various depths of the lake at different intervals. Also, productivity indicators such as chlorophyll content and turbidity concentrations were determined using a medium resolution MODIS sensor.
Furthermore, water quality parameters were retrieved from the sensor by application of the Single Correlated Scattering Radiance and the Atmospherically Corrected Reflectance approaches. Results indicated that the highest level of turbidity and chlorophyll content occurred at the thermocline and at a depth of about 20m.
Again, the researchers concluded that Single Correlated Scattering Radiance was a better approach since it provided reliable and credible data. However, it was noted that either of the two approaches could be used at different times of the year since there was co-variance of parameters. The researchers concluded that problems were presented when a specific consistent algorithm was used.
To determine if the sensor was able to evaluate water quality fluctuations, the researchers formulated a daily Two Time Complete Series approach. From the results, the sensor detected inputs from river discharges and particulate depositions from the atmosphere at weekly or monthly basis. Having obtained this information, the researchers concluded that the MODIS remote sensor was able to monitor the quality of water in Lake Flathead (Reza, 2008, p. 801).
On the other hand, the coastal areas of the United Arab Emirates often experience oil spills, and this presents serious environmental concerns. Such catastrophe often worsens once proper monitoring mechanisms are not put into place. Fortunately, the MODIS remote sensor can guarantee maximum surveillance if put into use and properly managed. During its application, key responsibilities of the MODIS remote sensor include detecting and evaluating the amount of oil spillage.
To discriminate oil spills, a 250m spatial resolution of the MODIS sensor is set since oil spills involve a small surface area. To help the investigator distinguish surface water phenomena from objects like ships, it is important to enhance data contrast by making some adjustments on the 250m bands2 of the sensor (Li et al., 2003, p.559).
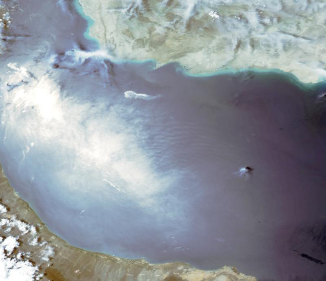
Again, to ensure that the region of interest enables the researcher to determine both the maximum and minimum values regarding the area of oil spillage, shadows resulting from oil are excluded since they may give a false impression of oil (Fingas, 2000, p.25). In the Republic of South Africa, a similar application of the sensor was successfully done, and the following figure representing oil spillage under sunlight was then generated in 25th May, 2005.

Reference List
Clark, G. L., Ewing, G. C., & Lorenzen, C. J. (1970). Spectra of backscattered light from the sea obtained from aircraft as a measure of chlorophyll concentration. Science, 167, 1119-1121.
Esaias, W. E. (1998). An overview of MODIS capabilities for ocean science observations. IEEE Transactions on Geosciences and Remote Sensing, 36, 1250-1265.
Fingas, M. (2000). Oil-spill remote sensing. Sea Technol., 41, 21-26.
Li, R., Kaufman, Y. J., & Gao, B. (2003). Remote sensing of suspended sediments and shallow coastal waters. IEEE Trans. Geosc. Remote Sens., 41, 559.
Morel, A., & Prieur, L. (1977). Analysis of variations in ocean color. Limnol Oceanogr, 22, 709-722.
Reza, M. (2008). Assessment of Suspended Sediments Concentration in Surface Waters Using MODIS Images. Am. J. Appl. Sc., 5, 798-804.