Executive Summary
This report has been prepared to aid Green Onyx manage its order processing smoothly. A system is composed of subsystems that function jointly as one. A delay in one part of the system will cause a delay in the entire system.
At Green Onyx one of the bottlenecks causing a delay in the ordering process was occasioned by paper trail. For instance, the sales department has to wait for approval or copies of the approved order from the credit section thus delaying to issue notice to stores to prepare goods for dispatch.
This causes a delay in the entire delivery. To rectify this problem the ordering process should be considered as an integrated system to avoid the paper trail and duplication of data. A central online system will aid in system effectiveness. All the information will be obtained online; credit section will only need to update the customer information in the credit database. On receipt of order the sales department will have access to the information from the central system.
Data flow diagrams make the process visible. The company is able to know what inputs are required at each level. Orientation is easier for a new employee and there is less need for close supervision of the process as the process is clearly defined. As the Data Flow Diagrams are decomposed the process becomes clearer.
This reduces the need for rework in a process. The result of which is cost cuts to the company. The quality of service to the clients is improved. This approach is a structured systems approach. It breaks down the complex jobs to simpler jobs that are manageable; using system tools such as data flow diagrams, flow charts and structure charts.
The structured approach to the process also increases accountability because ownership of tasks is defined from the onset. This has the advantage of increasing efficiency in use of resources. Systems approach to management helps define how different activities operate and how they can be improved continuously. This is by measuring and evaluation of a systems performance. It also helps individuals in an organization understand the interdependencies in the processes.
Introduction
This report aims to discuss the application of business analysis tools and techniques in the analysis of everyday business problems. The main objective in the management of a business is to provide high quality goods and services to meet customer demands. For this objective to be met, work has to be carried out in an organized manner. All tasks that are involved have to be scheduled.
A schedule is a detailed plan of operations so that all involved in the process are aware of the tasks at hand, when they are to be carried out done and by whom they are to be done. Before the schedule is designed and implemented, the organization must outline what it intends to achieve (Burnes, 2004).
The objectives could range from cost minimization, reducing the levels of stock, improving cash flow or to maximize the use of resources. A schedule may be simple for example a things to do list, a checking checkout roster or an equipments inventory register. In some instances, a schedule may be more complicated and in consequence require a more sophisticated system. This systems include; GANTT charts, just in time (JIT), network analysis such as program evaluation review techniques (PERT) among others.
The company may consider applying either closed or open systems. Closed systems are systems that do not rely on their environment, they chart their own unique path and do no transact with the outside world. An example is an astronaut’s life support pack. Open systems interact with the environment.
They exhibit characteristics like use of inputs and discharge of outputs and transacting with the environment. In this paper we discuss open systems at length. Green Onyx operates an open system. It procures inputs which are expended in the production of sunglasses.
This involves taking the inputs through various production processes before the final product is ready for release in the market. For a smooth transition in the production process, a schedule of the work flow needs to be mapped. This will ensure bottlenecks that would otherwise slow down or ground the process all together are ironed out (Barrien, 1976)
Gantt Chart
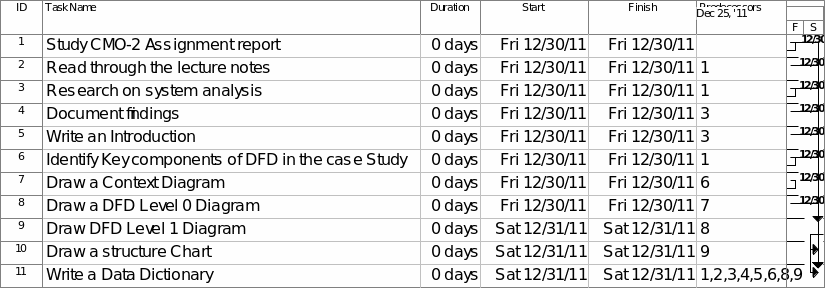
Activities in the Gantt chart that will aid complete the report are as follows:
- Read through the COM_ 102 assignment to establish what the assignment requires. This will give a general view and understanding of the work to be covered.
- Read through the provided lecture notes to provide inputs for the assignment. The sample reading will also aid in the structure required for the report. Brief notes are made to provide for later reference.
- Research on available texts on system analysis, project management and quality in processes.
- Study the case to identify the key activities, data stores, processes, organizations and departments involved. This is drafted to give a summary of events and the data input and output.
- Draw a context diagram. This diagram gives details on the relationship between the business and the outside environment. This is the relationship between the company and the customer.
- Draw a Level 0 Data Flow Diagram (DFD). This will give the main view of the process. The key activities conducted in the ordering process.
- Draw a Level 1 Data flow diagram. This diagram gives an exploded version of the Level 0 DFD. Processes in Level 0 are broken down to more simplified activities.
- Draw a structure chart which shows a number of DFDs in one structure. A complex process may give winding data flow diagrams that may be hard to comprehend.
- Document the data dictionary showing the data requirements for the system. This aid the organization in the data update.
The time schedule for the report is one day. The activities are split in to 24 hours. Resource utilized is time that is used in research and recording the findings. Preparation and drafting of the report is considered. Emphasis of the Gantt chart is on the time allocated to the activities in a project. This will ensure that the project is on schedule and resource allocation is efficient (Harris, 1995).
Purpose of Gantt chart
It is a tool used in project planning and analysis. Its outlines the sequence of activities required to complete a project giving the required duration. It shows which activities may be critical for the project to be accomplished. There are activities that have to be performed before others in the list can commence. For instance, one cannot start writing this report without reading through the case study given. The resource allocation in term of time, people and materials are outlined. This helps in budgeting and planning of a project (Doss, 2006).

Chart 1. Gantt chart for the report.
Data Flow Diagram Context Diagram
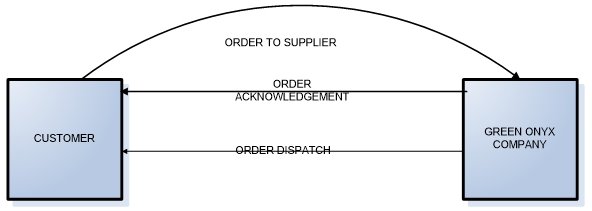
An open system does not operate in isolation it is continuous contact with the environment. The DFD context diagram shows the interaction of a system with the operating environment. This can consist of the external forces for instance suppliers, government agencies, clients, competitors and financial institutions.
The data flow arrows indicate the input and output in the interactions. In this ordering process Green Onyx company interacts with the customers that make orders for sunglasses. On order placement, acknowledgement and delivery. There may be back orders or return that will have to be dealt with. It shows a clear picture of an organization as an open system (Robbins, 1998).

Figure 1
Data Flow Diagram Level 0
This diagram shows the main tasks in the order processing of Green Onyx. The company has to adopt an online integrated system. This will aid in the effectiveness of the ordering process. The ordering process will consist of five major activities which will operate on an integrated platform.
This means the data will be pooled at a central system. The duplication of the reports will be avoided. All the information on an order can be trace by the order number or the customer information. The system stores customer information and order no and shows the inventory levels at any given time.
A search on data can be conducted on both customer information and order number. Specific information can be obtained on orders and clients separately. Reports can be pulled out on orders received by activating and deactivating different data input. This can be drafted in excel and reports created from access or other software packages that aid in data.
Tasks include
- Order receipt by the sales department.
- Order analysis and approval by the credit section.
- Order receipt by stores for quantity allocation
- Goods send to dispatch and packaging
- Invoicing of order by the invoicing department for record and payment
This is a general view of the ordering process at the company. The sales department does not need to duplicate the order in five copies on receipt. The data is input online saved and mailed to the credit section. The section performs an online analysis on credit credibility and mails back the reply and stores the approval in the central data system. On receipt the sells person mails the approval to the customer and notifies stores to quantify and release the goods to dispatch. Invoicing department can get the information on the dispatch and invoice the client. Integration of the system saves resources in terms of time, people and funds (Kast, 1985)

Figure 2
Data Flow Diagram Level 1
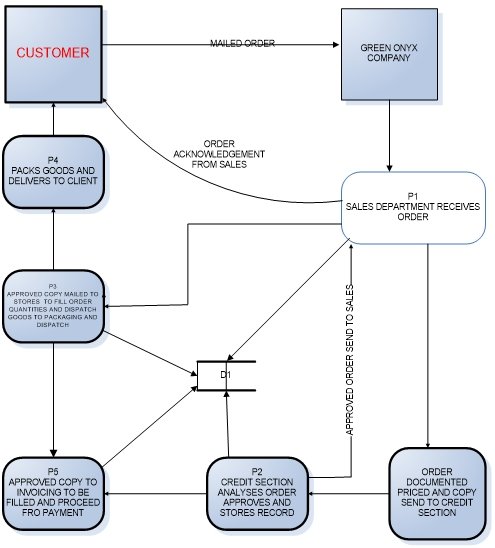
This diagram shows a decomposition of three processes. The processes explodes are the sales department receipt of order, credit department receipt of order and order receipt by stores. This is the child diagram of the data flow diagram of level 0. It contains parts of the DFD level 0 and additional elements of the decomposed processes.
Sales department on receipt of order documents the order by in putting the customer information in the system. This includes the name, the order number, the items codes, quantity, date and time. This storage of information will aid any employee of sales access the information on recent orders or customer data.
It does not limit the data to order number or customer information. The order is priced and sent to the credit section. Sales department inputs the prices depending on the item codes. This pricing is different from one listed in stores. Sales department issues prices according to the market prices that will generate profits for the company.
The credit section receives the order copy by mail and values the order. If it’s a current customer the value is added to the outstanding balance and it is established if the credit limit has been exceeded or it’s within the limit. After the analysis an approval is made and data send to the central database. A copy is mailed back to the sales department which acknowledges the order to the buyer and sends to stores.
Stores department has the task of quantifying the order and fills in the order. The goods are then released to packaging and dispatch section. Stores role does not end on release of goods. The inventory records have to be updated regularly.
This will aid stores order from suppliers when they are running out of stock or establish the re-order levels, minimum and maximum levels. Stores will know what economic quantities to hold. Evaluation of the delivered orders are also done to establish if there were any back orders so as they can be dispatched to the clients.

Figure 3
Structure chart
Data flow diagrams can be complex when draw on one platform. The structure chart helps display several DFDs on one platform. This simplifies the visibility of a process. For instance a data flow diagram with eight processes and exploded further to five processes can be complex in visibility and drawing.
The chart has exploded the order analysis and approval process and the invoicing department roles. Complex projects like construction of dams, major highways and airports would have much complex strictures. This will stretch to cover years for their completion. Activities involved will be many in number and complex in planning. Good project management skills will be required (Lientz 2002).

Figure 4
Data Dictionary
It shows the data requirements for the system to function. It shows the processes, data stores, and sources of data from location.
Green Onyx Company’s data dictionary for the ordering process
Data store= central computer database
Data= stocks
Location= stores and procurement
Processes:
- Receipt of order
- Analysis
- Approval
- Packaging and Dispatch
- Invoicing
Conclusion
Green Onyx Company can re-design its ordering process to a more efficient system. From the duplicated copies of the order forms send across the departments and filled it can be assumed its operating a manual system. In process time cycle duplication is considered as a non- value adding activity.
More effort and resources can be channeled to value adding activities. Time is one of the most important resources and it determines wealth to be created though efficient processes. Process boundaries should be established and activities planned to manage time. Those activities that involve rework mean that resources are waste even though the rework was adding value. Rework , movement, delays can be eliminated.
A computerized integrated system will aid the company design a more efficient ordering process. Storage of data in a central database improves the communication and access to information. Using selected tools in project planning and scheduling the company ordering process will be designed to serve customers better and create a competitive advantage for the company.
Control charts can be draw to establish if the process is in control in so doing improve on the quality of the system. These charts can act as problem solving tool as they will indicate limits in processes and avoid out of control activities (Dunning, 1981).
The production process up to the delivery point of products runs without hitches. Bottle necks that would otherwise slow down the process are alleviated because a clear path of how tasks follow each other is laid down ahead of the process. It also makes it easier for a new employee to pick up the process incase a key resource was to be laid off (Dwyer, 2005).
This storage of information will aid any employee of sales access the information on recent orders or customer data. It does not limit the data to order number or customer information. The order is priced and sent to the credit section. Sales department inputs the prices depending on the item codes. This pricing is different from one listed in stores. Sales department issues prices according to the market prices that will generate profits for the company.
The structured approach to the process also increases accountability because ownership of tasks is defined from the onset. This has the advantage of increasing efficiency in use of resources. Systems approach to management helps define how different activities operate and how they can be improved continuously. This is by measuring and evaluation of a systems performance. It also helps individuals in an organization understand the interdependencies in the processes.
Bibliography
Barrien, K, F 1976, A general systems approach, Chicago: Rand Millay College Publishing company.
Burnes, B 2004, Managing change: a strategic approach to organization dynamics, Essex: Prentice Hall.
Doss, G., Wallace, M., & Webber, L. 2006, IS Project Management Handbook, Aspen Publishers.
Dunning,J, H 1981, International Production and Multinational Enterpise, London: George Allen and Union Publishers.
Dwyer, J. 2003, The Business Communication Handbook, 6th Edition, Australia: Prentice Hall.
Kast, F, & Rosenzweig, E 1985, Organization and management, Singapore: McGraw Hill, Inc,.
Lientz B. P., Rea K. P. 2002, Project Management for the 21st Century, Academic Press
Marchewka, J. T., 2003, Information Technology Project Management, Pinkerton: Wiley Hoboken.
Robbins, S.P, Millett, B., Cacioppe, R. and Waters-Marsh, T. 1998, Organisational Behaviour: Leading and Managing in Australia and New Zealand, 2nd Edition, Australia: Prentice-Hall.