Introduction
The transport sector is among the most important factors promoting economic growth. The sector is responsible for documenting how roads are used and keeping an account of road accidents. Over the last few years, the Australian government has had difficulty trying to identify why the rates increased despite implementing road safety mechanisms.
The current project seeks to establish a reasonable cause and help reduce the cost and damages brought by road accidents. The main objective of this investigation is to determine the cause of crashes to help authorities in the transport sector establish techniques for reducing road crashes. This can be conducted by studying different predictors, but in the case of this investigation, drunk driving is given priority. Therefore, we seek to establish a link between alcohol consumption and an accident.
Data
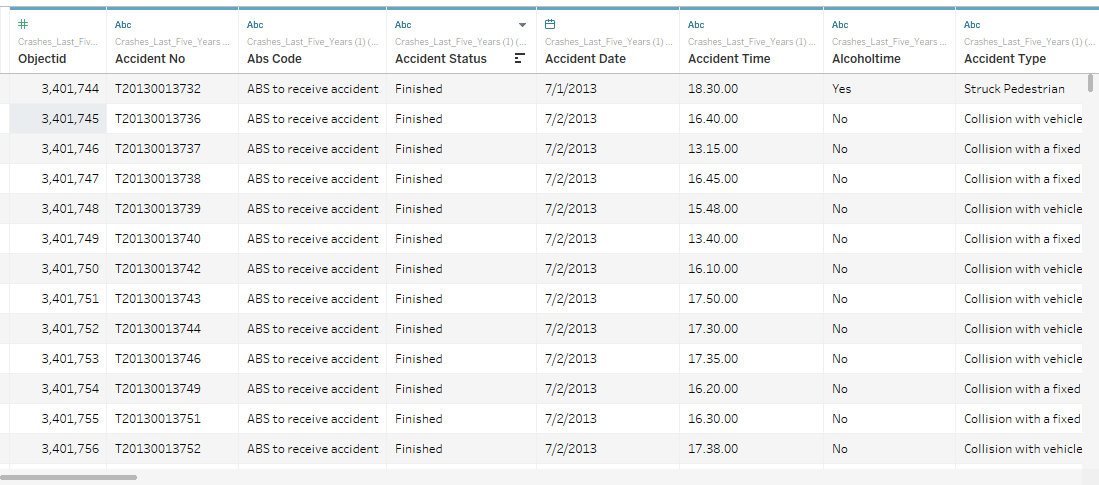
The data used in this project is obtained from the Australian transport department and presents road crashes for the last five years from 2013 to 2019. Data preparation, including wrangling and cleaning, will be done, and findings from explorative data analysis will be used to provide key insights into the data. There are 74,908 entries of road accidents keyed across 63 attributes, including region name and gender.

Data cleaning
Data cleaning is done to ensure that the dataset only contains entries relevant to the project. The first step involved the removal of unnecessary columns. The data contains several identifiers, including ‘OBJECT_ID,’ ‘ACCIDENT_NO,’ and ‘NODE_ID.’ Only one identifier, ‘OBJECT_ID,’ will be retained. Additionally, there are different coordinate options such as ‘LONGITUDE,’ ‘LATITUDE,’ ‘VICGRID_X,’ and ‘VICGRID_Y’ that can be reduced to maintain only one option.
There are also several missing entries, including those for ‘SRNS’ and ‘SRNS_ALL.’ For instance, there were 53,244 missing entries for ‘SRNS’ and ‘SRNS_ALL,’ over 71% of the entire dataset. These columns were also removed because the missing data was significant, and completing them would be difficult. Tableau’s data conversion function converted the remaining attributes into appropriate data types. For instance, ‘LGA_NAME’ represents Australia’s Local Government Area which was converted into ‘County’ in Tableau.
At the same time, ‘REGION_NAME’ was converted into ‘Country/Region.’ Tableau also has an important geographic region feature which was significant in the project, especially during assigning missing locations for the missing data. The day of the week factor was also significant for exploration. Therefore, all entries with blank days of the week were removed.
Exploratory Data Analysis
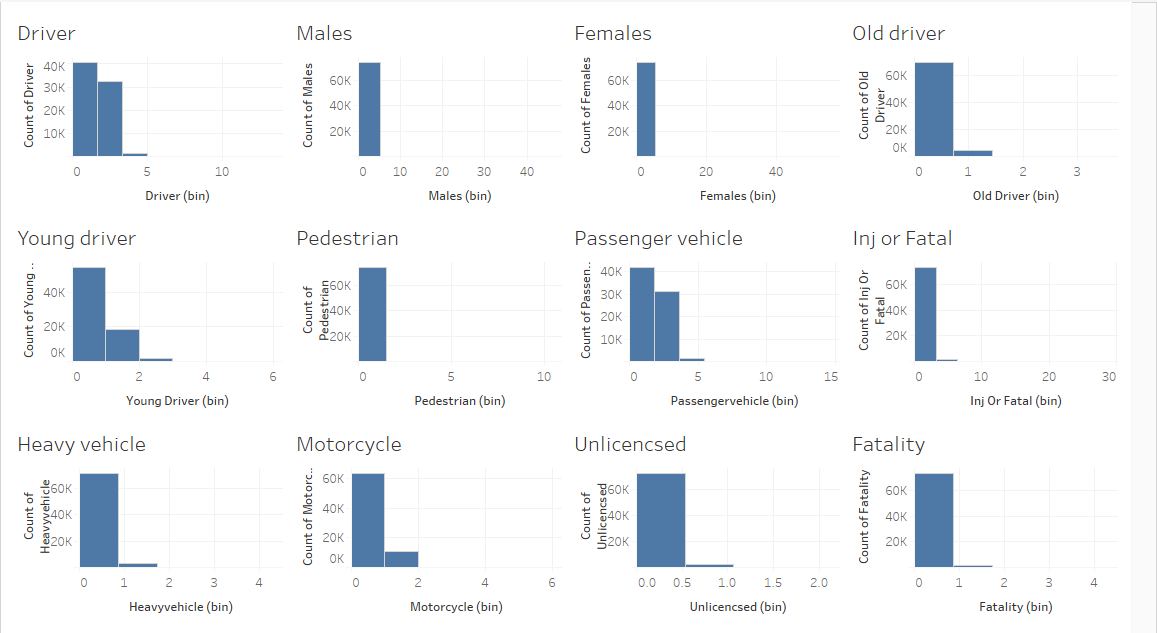
The retained variables of interest were in line with the study’s objective. Twelve attributes spanning driver status, gender, age, vehicle type, and fatality were included in the investigation. These included ‘DRIVER,’ ‘MALES,’ ‘FEMALES,’ ‘OLD_DRIVER,’ ‘YOUNG_DRIVER,’ ‘PEDESTRIAN,’ ‘PASSENGER_VEHICLE,’ ‘INJ_OR_FATAL,’ ‘HEAVY_VEHICLE,’ ‘MOTORCYCLE,’ ‘UNLICENSED,’ and ‘FATALITY.’ These entries were represented using histograms to illustrate their distribution. The dashboard illustrates these entries to provide a better understanding of their frequency. It is also important to note the numeric feature distribution of these entries based on histograms where the x-axis illustrates the values while the y-axis illustrates their frequency.

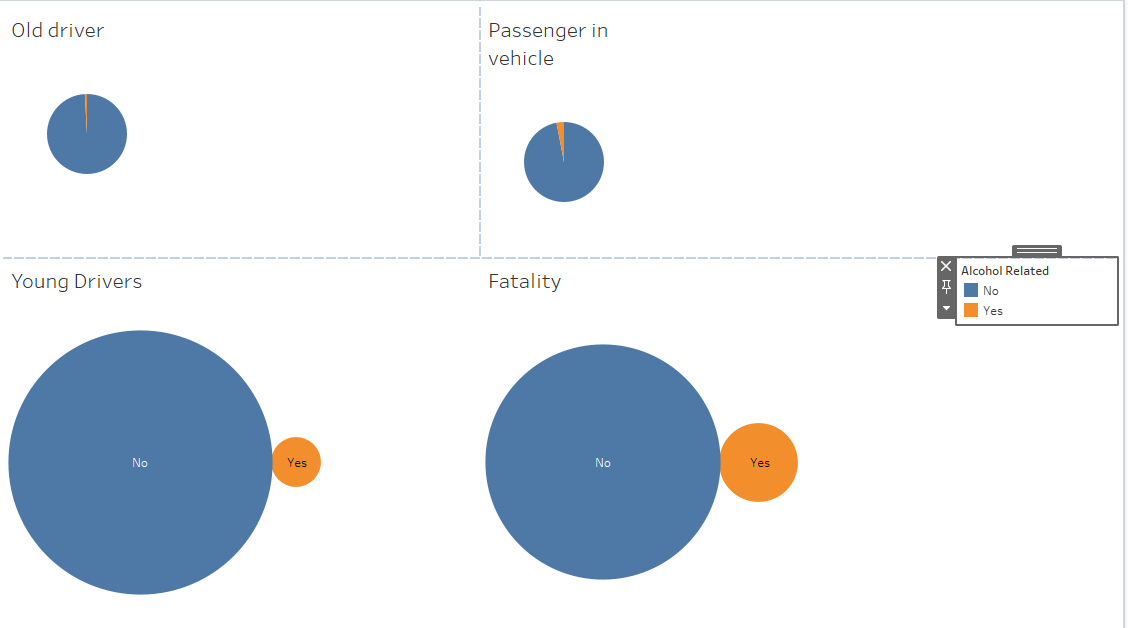
From the main objective of establishing a connection between car crashes and alcohol consumption, the analysis revealed insightful observations. For instance, injuries above 10 are less likely to be attributed to alcohol consumption. More passenger cars involved in an accident did not mean that all drivers were under alcohol consumption. However, the analysis revealed that there are some elements of alcohol use among old and young drivers contributing to car crashes. The dashboard illustrates these observations with a focus on lower incidences involving alcohol consumption.

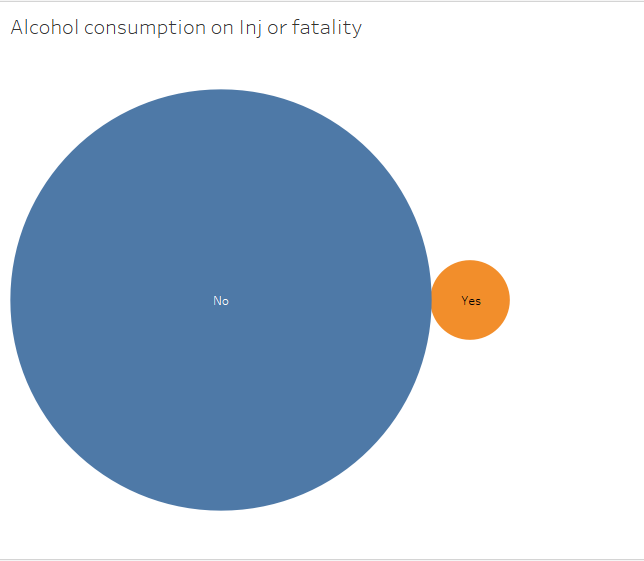
Another important analysis was the role of alcohol in crashes. Here, the focus was on the outcome of an accident, injury, or fatality due to alcohol consumption. Again, we note that alcohol consumption is not a major predictor of the outcome of a crash. However, there are several instances where alcohol has resulted in casualties. Despite this, the number is low compared to no relationship suggesting that more casualties in road crashes are not alcohol-related. Various studies reveal that drunk drivers cause many road crashes despite other factors, such as improved infrastructure, light conditions, and the number of vehicles involved (Wright and Lee, 2021).
The investigation also aimed to reveal this observation by focusing on alcohol as a significant predictor of road crashes. However, since the visualizations illustrate a different finding, it is accurate to predict that other factors characterize alcohol-based road crashes. This realization is made after affirming that alcohol-based crashes are only responsible for lower crashes resulting in an injury or fatality. At the same time, non-alcohol-related incidences lead to increased crashes. Therefore, it is essential to establish a causal or inherent relationship between the relative factors contributing to alcohol-related crashes.

Lighting
Lighting condition was also another important consideration to complement the findings of this investigation. There is a perception that lighting conditions can contribute to road accidents, especially when drivers are under alcohol (Keall et al., 2005; Li and Chihuri, 2019). This information is vital when establishing working interventions to reduce road crashes. Most scholars have revealed that alcohol consumption is a major predictor of road crashes (Carfora et al., 2018; Lasota et al., 2020). This would suggest several underlying factors contributing to road crashes caused by drunk driving. These observations also translate to how a road is used at different times of the day and the occurrence of crashes. For instance, lighting influences the frequency of nighttime crashes instead of daytime crashes.
Based on this assumption, it is essential to note that road lighting has vital road safety benefits that reduce the prevalence of crashes. The data illustrates crashes on roads in Victoria, which are mostly in urban regions suggesting that crashes are common despite the characteristics of a region. Therefore, these situations can be depicted as having poor or improved lighting conditions based on the recorded crashes. The challenge arises in defining what poor and improved conditions consist of since there is no causal relationship between safety and lighting parameters where authorities and researchers can establish lighting standards for safety. As a result, concentration on improving lighting to increase road safety would still fall under the broader funding category for road safety.
Conclusion
We can conclude that crashes are not only predicated on alcohol consumption from the analysis. This has been shown by greater incidences where drivers were sober, suggesting that other unidentified elements caused the increased rate. This perception does not address the objective of this investigation but paves the way for further investigations about the predictors contributing to road crashes due to alcohol consumption.
Currently, lighting conditions have been considered the major predictor of this condition based on previous research, but determining their prevalence in contributing to crashes is not yet achieved, mainly because most studies that suggest this were conducted over ten years ago. It is also important to consider that economic growth translates to improved infrastructure, which would suggest that many roads will be equipped with new lighting technologies to try and minimize road crashes. Therefore, there is a concern growing enough to establish a link between lighting conditions and alcohol-related road crashes through multivariate studies.
Recommendations
Road crashes are a growing area of concern for the Australian government, despite the measures introduced to curtail their prevalence. The current investigation reveals that the relationship between road crashes and alcohol consumption is very low, suggesting that other factors should be considered. Several additional elements can provide comprehensive results from the data, such as location, time of the day, and speed limit. For instance, location becomes a significant measure as it compares accident prevalence between different regions (Ochieng et al., 2022). If one region records a lower rate, recommendations will be based on the interventions carried out in the study region.
On the other hand, if the time of day is considered, authorities will evaluate the prevalence of an accident based on time and issue interventions suited to address the issue, such as reduced traffic usage during specific times or increased traffic supervision during risk times (Eboli et al., 2020). Finally, suppose speed is considered the major cause of car crashes. In that case, traffic authorities will be responsible for regular traffic supervision, employing advanced technologies to monitor how motorists are using the road and if they observe the maximum speed limit assigned to a given area (Zhang et al., 2022). Such measures can only be implemented if future investigations can establish a link between the said factors and the prevalence of road crashes.
Tableau Data Visualization
The current investigation has attempted to establish the relationship between road crashes on alcohol consumption, failing to establish a strong link. However, the visualization approach employed with Tableau’s visualization tools presents an explorative presentation of data, including key indicators used in the study. The investigation includes two dashboards focusing on different indicators. For instance, the first dashboard illustrating the frequency of roach crashes based on driver status, age, and vehicle type includes histograms presented in a blue bar. Since the entries all illustrate the same rising trend, the color presents an overview of a positive increase.
References
Carfora, A., Campobasso, C.P., Cassandro, P., Petrella, R. and Borriello, R., 2018. Alcohol and drugs use among drivers injured in road accidents in Campania (Italy): A 8-years retrospective analysis. Forensic Science International, 288, pp.291-296.
Eboli, L., Forciniti, C. and Mazzulla, G., 2020. Factors influencing accident severity: an analysis by road accident type. Transportation Research Procedia, 47, pp.449-456.
Keall, M.D., Frith, W.J. and Patterson, T.L., 2005. The contribution of alcohol to night time crash risk and other risks of night driving. Accident Analysis & Prevention, 37(5), pp.816-824.
Lasota, D., Al-Wathinani, A., Krajewski, P., Goniewicz, K. and Pawłowski, W., 2020. Alcohol and road accidents involving pedestrians as unprotected road users. International Journal of Environmental Research and Public Health, 17(23), p.8995.
Li, G. and Chihuri, S., 2019. Prescription opioids, alcohol and fatal motor vehicle crashes: a population-based case-control study. Injury Epidemiology, 6(1), pp.1-8.
Ochieng, W.O., Cheruiyot, K.W. and Okeyo, G., 2022. RFID-based location-based services framework for alerting on black spots for accident prevention. Egyptian Informatics Journal, 23(1), pp.65-72.
Wright, N.A. and Lee, L.T., 2021. Alcohol-related traffic laws and drunk-driving fatal accidents. Accident Analysis & Prevention, 161, p.106358.
Zhang, W., Yi, J., Zhou, G. and Liu, T., 2022. Drivers’ decelerating behaviors in expressway accident segments under different speed limit schemes. International Journal of Environmental Research and Public Health, 19(3), p.1590.