Introduction
The purpose of this paper is to determine the best forecasting method for the stock prices of Volkswagen AG based on the eight points of data between January 19, 2023 and January 30, 2023. I will used three different methods and measure their mean absolute deviation (MAD) to select the best option. The forecasting methods include moving average, weighted moving average, and exponential. The data used for the analysis were taken from Yahoo Finance. The dataset is provided in Table 1 below.
Table 1. Dataset
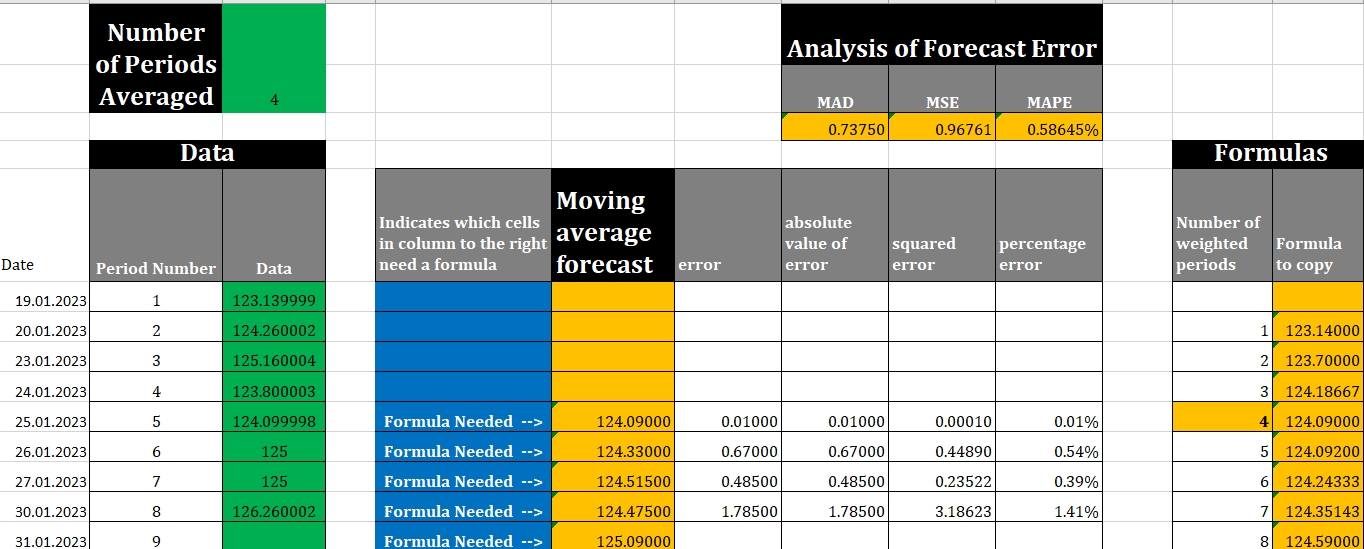
First, moving average was used to make the forecast. I selected to do a four-period forecast, as it appeared the most appropriate. In order to make the forecast, the following steps were followed:
- Opened 4. CA_M5_Moving Averages template file and went on ‘4 periods’ tab;
- Copied the dates to the data column starting from A6 to A14;
- Copied the close prices to the data column starting from C6 to C13;
- Recorded the forecast for the next period and MAD.
MAD for the analysis was 0.7375 and the prediction for the next period was 125.09. The screenshot of the calculations is provided in Figure 1 below.

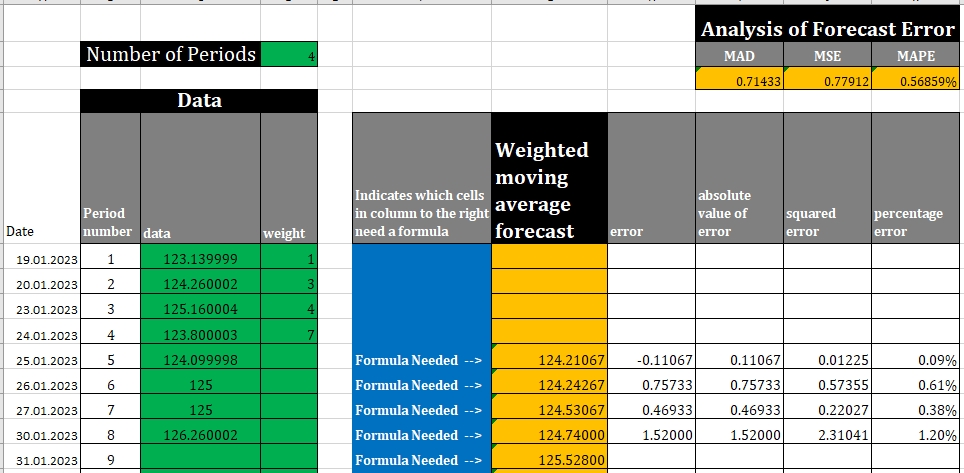
Second, weighted moving average was used to make the forecast. I selected to do a four-period forecast, as it appeared the most appropriate. The weights for the periods were left untouched. In order to make the forecast, the following steps were followed:
- Opened 5. CA_M5_Weighted Moving Averages template file and went on ‘4 periods’ tab;
- Copied the dates to the data column starting from A6 to A14;
- Copied the close prices to the data column starting from C6 to C13;
- Recorded the forecast for the next period and MAD.
MAD for the analysis was 0.71433 and the prediction for the next period was 125.528. The screenshot of the calculations is provided in Figure 2 below.

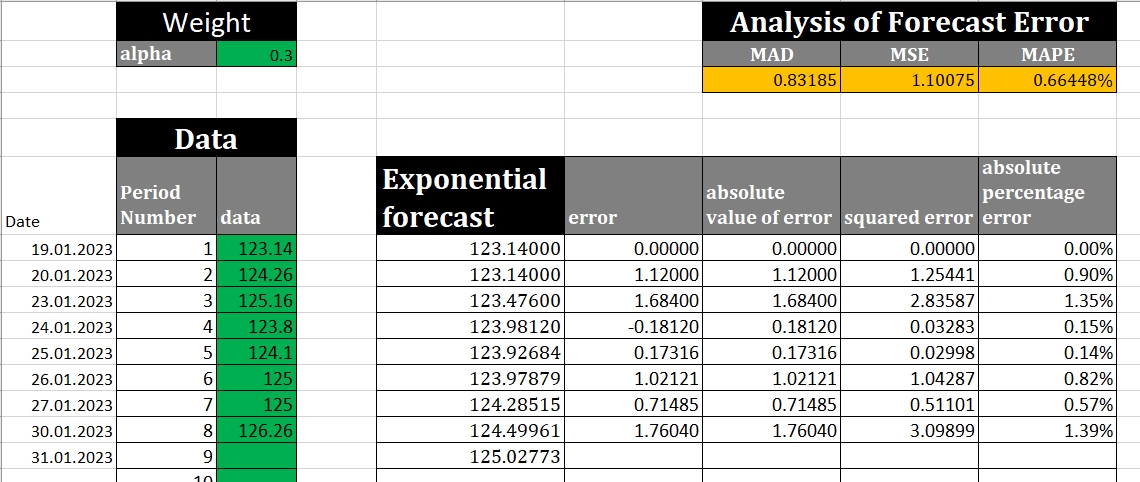
Finally, exponential forecasting was used to make the forecast. I selected to do a four-period forecast, as it appeared the most appropriate. The weights for the periods were left untouched. In order to make the forecast, the following steps were followed:
- Opened 6. CA-M5_Exponential Forecasting template;
- Copied the dates to the data column starting from A7 to A15;
- Copied the close prices to the data column starting from C7 to C14;
- Recorded the forecast for the next period and MAD.
MAD for the analysis was 0.83185 and the prediction for the next period was 125.02773. The screenshot of the calculations is provided in Figure 3 below.

Based on the MAD values, the best forecast was provided by weighted moving average forecast.
Here is the ranking of the forecast based on the MAD values:
- Weighted moving average;
- Moving average;
- Exponential forecasting.
I have ranked them this way because weighted moving average forecast had the lowest MAD of 0.71433, moving average forecast had a slightly higher MAD of 0.7375, and exponential forecast had the highest MAD of 0.83185.