Data Analysis
In this section, an analysis of the results derived from the methodology will be performed. Questionnaires were distributed to a sample of the United Arab Emirates (UAE) patients across three hospitals.
The questionnaire was designed to compare the gap in hospital performances across private and public hospitals using the SERVQAUL model. Close-ended questions were distributed to participants to investigate their perceived and expected perspectives on the hospitals’ performances. The results of the survey, which were coded and analyzed using SPSS, are presented in this chapter of the research. Tables and graphs illustrate the different perceptions of patients concerning service and quality across private hospitals and public hospitals.
Government Hospitals
This section of the paper illustrates the analysis of participants’ responses from two government hospitals.
Hospital 1
Hospital 1 is a government hospital located in the UAE. 84 participants from Hospital 1 responded to the questionnaires. The following charts and descriptions analyze their responses. The questionnaire used a Likert scale to describe the participants’ reactions to five aspects of service and quality. Higher scores represent higher degrees of service and quality of the attributes. The visual analysis of the chart above shows the patients in Hospital 1 (a government hospital) perceived that assurance factors had the highest influence on healthcare quality.
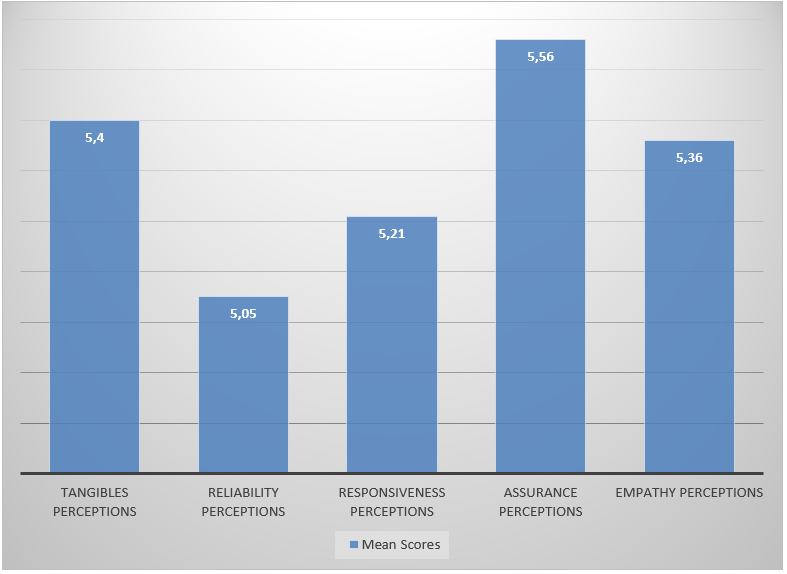
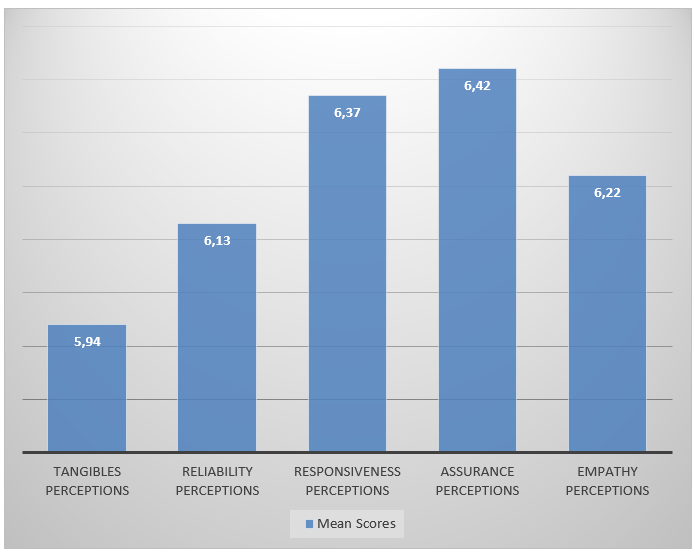
Managers of healthcare systems in the UAE can use the participants’ responses to understand the aspects of quality and service that need improvement (Ramachandran & Cram, 2005). The questionnaire used identical factors to investigate participants’ expectations of quality service across public and private hospitals. A visual analysis of Chart 2 shows that patients in Hospital 1, a government hospital, expected government hospitals to improve their service quality. Chart 3 further illustrates the difference between the expected service quality and perceived service quality. All bars representing the expected service quality are longer than the bars representing perceived service quality.
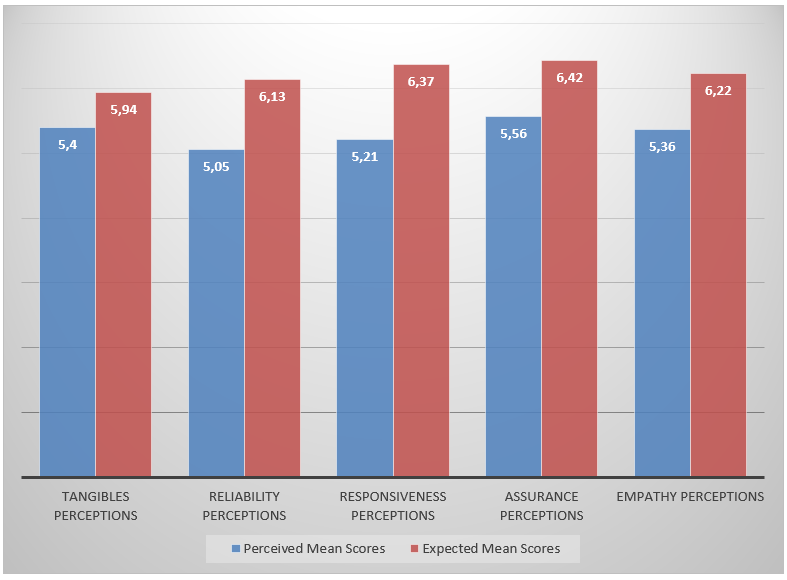
The chart above shows gaps between the expected and perceived quality of the aspects. A simple visual analysis of the chart shows a similar gap in all factors, however, the table below elaborates on the differences between the perceived and expected quality for each aspect.
Table 1: Percentage Gap between Perceived and Expected SERVQUAL Factors.
This research investigated elements in UAE’s healthcare system that needs improvement. An analysis of the gap between the participants’ perceived and expected service quality exposes the weakness in the UAE’s healthcare system. Responsiveness and reliability are two aspects of quality service that government healthcare administrators must improve (Westway et al. 2003). The medical personnel in government hospitals exhibit low responsiveness because the administrative aspect of these systems is controlled (Ovretveit 2004). Results in Table 1 show the need to include local and international government healthcare systems in developing healthcare personnel for improved reliability and responsiveness.
Hospital 2
127 participants from Hospital 2 responded to the questionnaires. The following charts and descriptions analyze their responses.
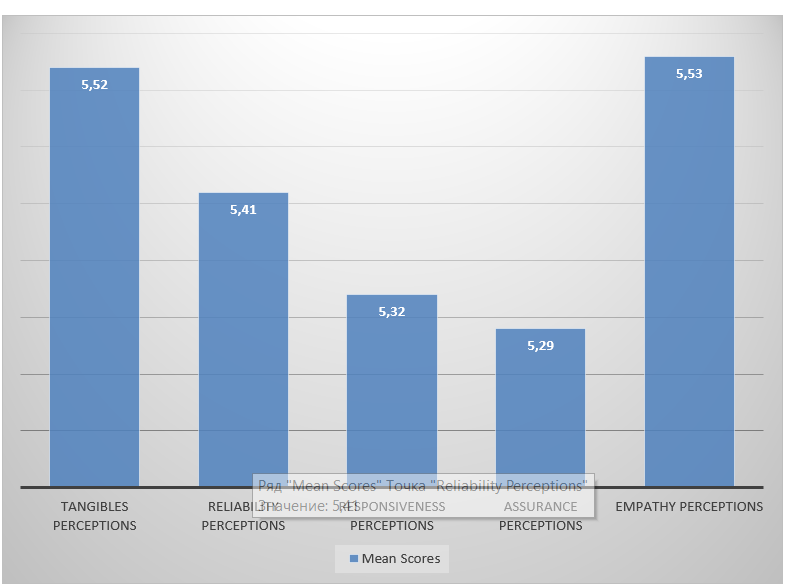
A visual analysis of Chart 4 shows the patients in Hospital 2 (a government hospital) perceived empathy and tangibles had the highest influences, while assurance had the least influence of the hospital’s service and quality. Chart 5 illustrates the service and quality expected by participants from UAE government hospitals. The participants expect improvements across all factors presented in the questionnaire.
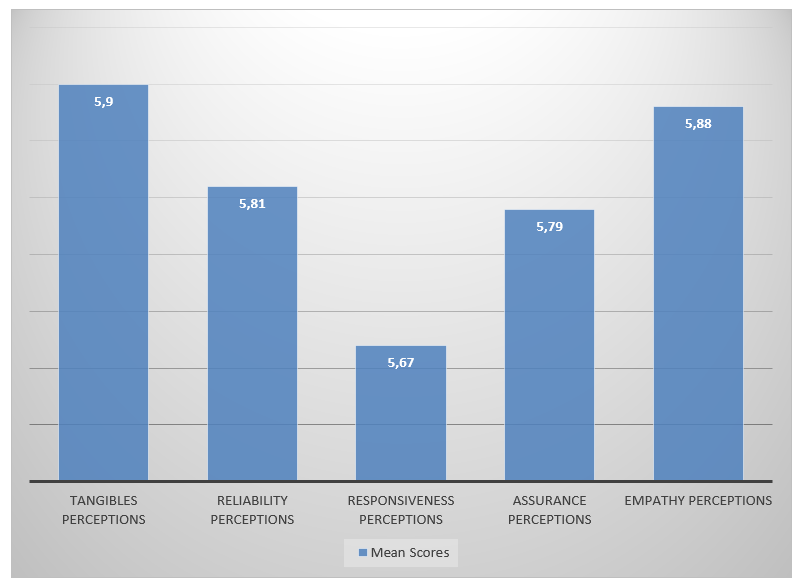
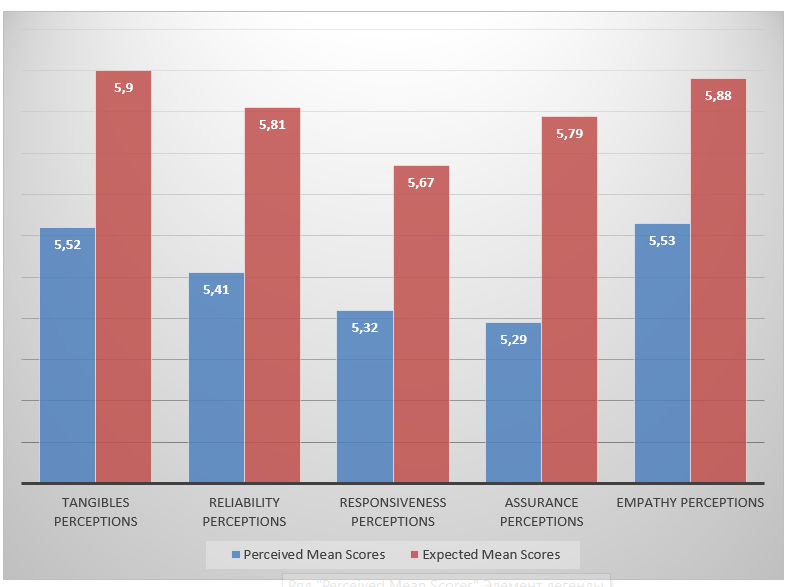
Chart 6 is a visual illustration of the gap between the perceived and expected levels of service quality offered at Hospital 2. Participants require the highest improvement in the assurance factor of service and quality. Table 2 uses gap percentages to elaborate on the differences between participants’ perceived and expected service quality in the UAE’s healthcare system. With a gap percentage greater than 9.5%, Table 2 supports the significance of quality assurance in the healthcare system. The least percentage gap is in the empathy aspect and this is in line with the suggestion that empathy is not a significant aspect of service quality in the healthcare system (Ygge & Arnetz, 2001).
Table 2: Percentage Gap between Perceived and Expected SERVQUAL Factors.
Private Hospital
This part examines the reactions of patients from the private hospital. 56 participants provided their perceived and expected opinions of the service quality offered in the private healthcare system. The following charts and descriptions analyze their responses.
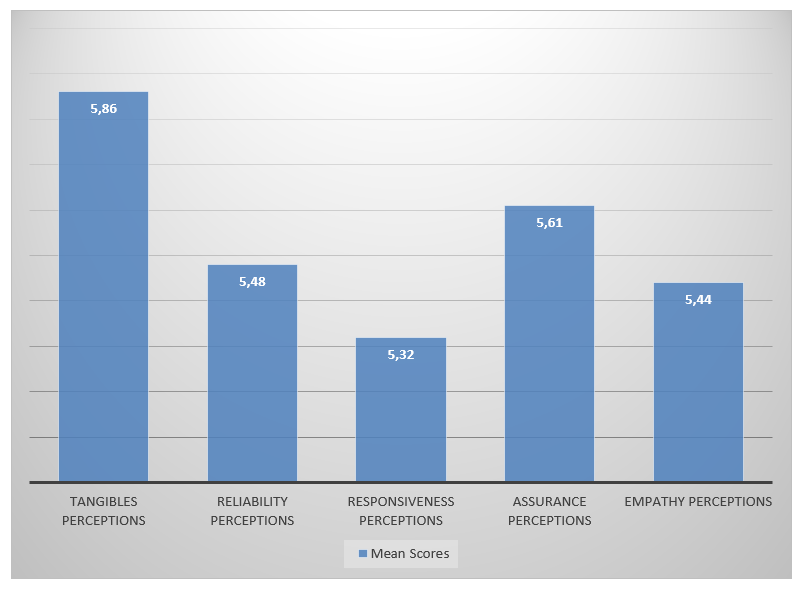
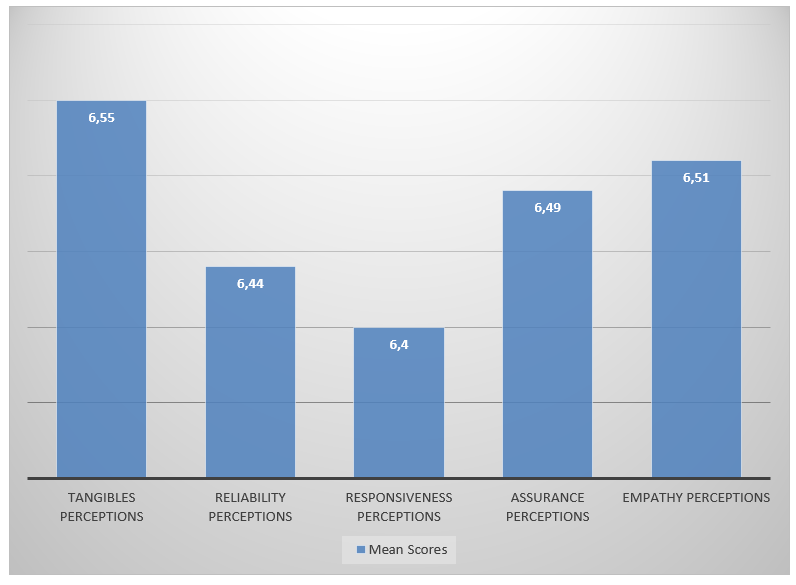
Chart 5 provides the average scores for each quality and service factor. The “Tangible” factor has the highest rating amongst participants, which means private hospitals pay attention to tangible variables, such as aesthetics and medical facilities when setting up their systems. The participants perceive that healthcare organizations in the private sector pay the least attention to responsiveness because, from their responses, they expected private hospitals to focus on providing high-quality tangibles. Chart 7 illustrates the participants’ responses, while Chart 8 provides a visual analysis of the gap between their perceived and expected characteristics of service quality in private hospitals.
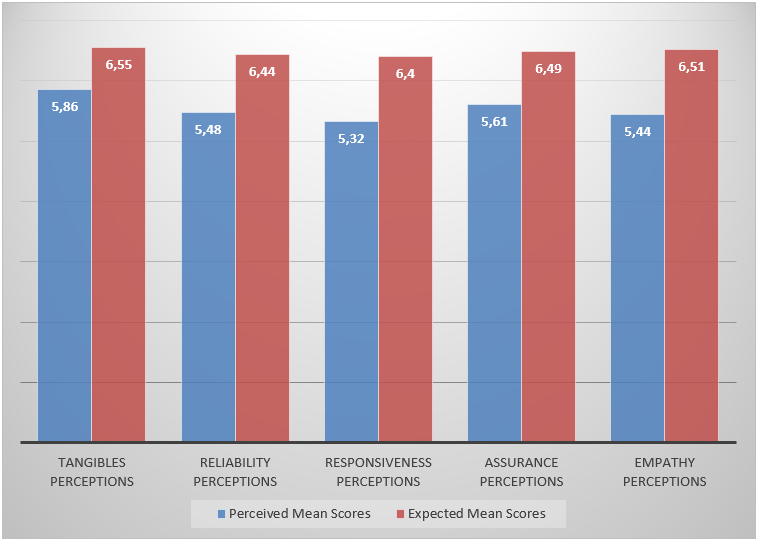
A visual analysis makes the gap between the perceived and expected aspects of service quality in appear equal in private hospitals. However, Table 3 below elaborates these gaps by expressing the percentage differences between the service quality aspects for private hospitals.
Table 3: Percentage Gap between Perceived and Expected SERVQUAL Factors.
Service Quality in Government and Private Hospitals
The data collected from the participants may represent the difference between perceived and expected service quality in government and private hospitals. This section of the chapter presents analyses that show the difference in service quality between public and private hospitals in the UAE.
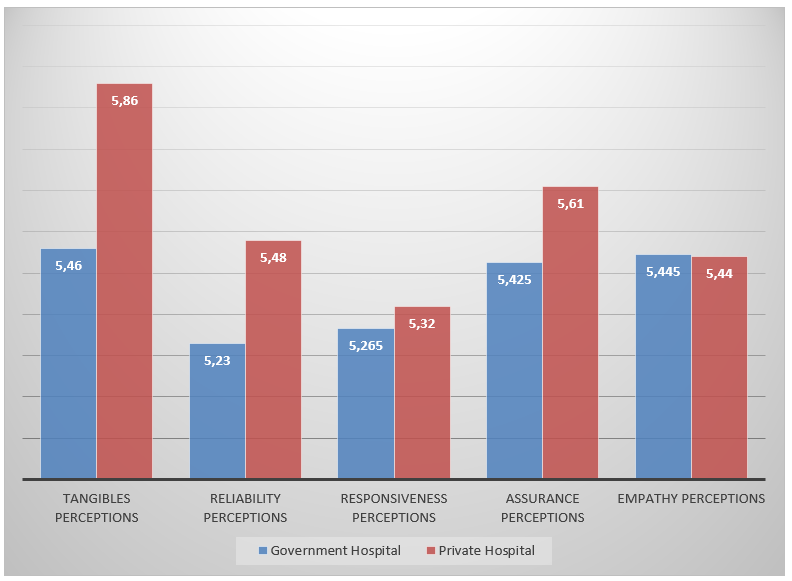
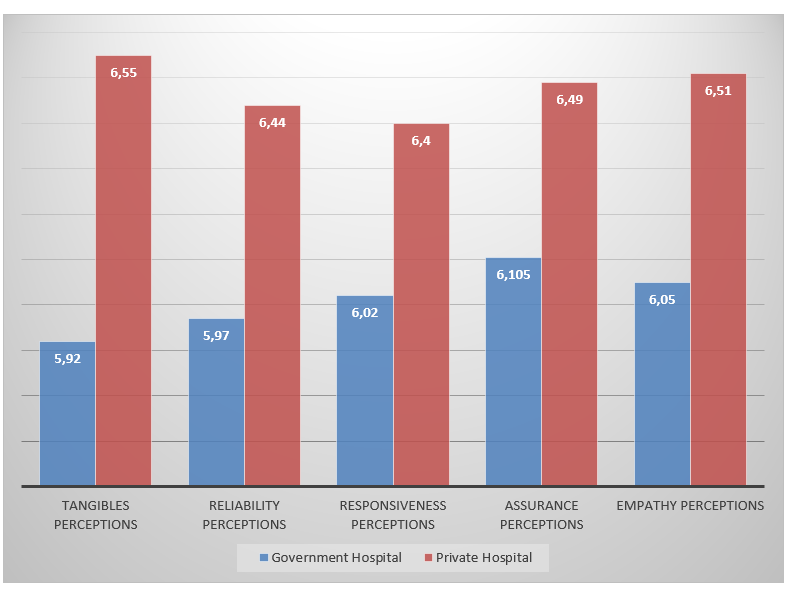
Chart 10 illustrates the perceived average scores for a government hospital and private hospital participants’ responses. The blue bars in the chart, which represents government hospitals, are shorter than the red charts. This difference shows higher quality service in private hospitals. Chart 11 shows the expected average scores for service quality in the UAE’s private and public hospitals. The red bars in the chart are significantly longer than the blue bars, thus, the participants expect more service quality from private hospitals.
The percentage gaps between perceived and expected quality conditions can represent the factors required by patients. Tables 4 and 5 summarise the percentage gaps between perceived and expected service quality in government and private hospitals. In Table 4, reliability and responsiveness show the highest gaps, with responsiveness and empathy showing the highest gaps in Table 5. Government and private hospitals in the UAE may consider improving their services with an emphasis on the identified quality aspects.
Table 4: Percentage Gap between Perceived and Expected SERVQUAL Factors in Government Hospitals.
Table 5: Percentage Gap between Perceived and Expected SERVQUAL Factors in Private Hospitals.
Chart 12 illustrates the magnitude of the percentage gaps computed for government and private hospitals. A visual analysis of the chart shows participants expect improvement in private hospitals. The analysis supports the premise that patients expect better services from private hospitals (Dey, Hariharan, & Brookes, 2006).

Significance of Service Quality Factors
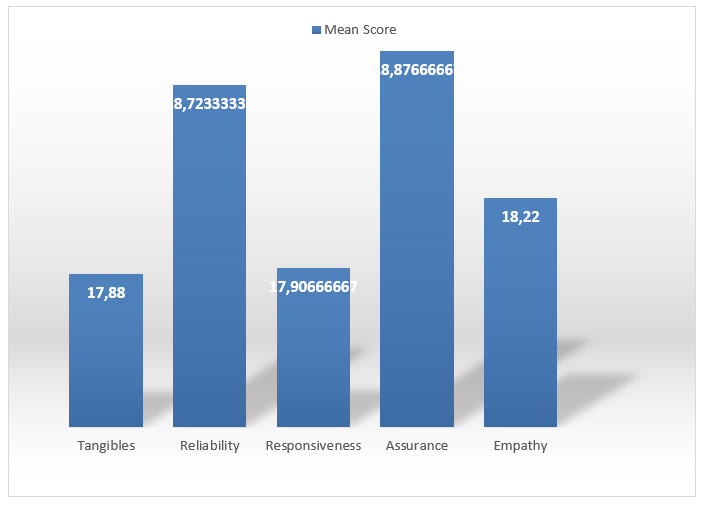
Five aspects were integrated to measure the service quality in public and private hospitals. Understanding these factors will contribute to the development of recommendations and responses to the research questions. The last section of the questionnaire asked participants to grade aspects of service quality on a 100% scale. The table below provides the average grades derived from the three samples. Chart 13 is a visual analysis of the graded table and illustrates assurance and reliability over the other aspects of service quality presented in the questionnaire.
Table 6: The Mean Averages for Aspects of Service Quality.
Recommendations
In the previous chapter, the factors affecting service quality were analyzed. This section provides recommendations from the results of the analyses. UAE hospitals should develop strategies aimed at improving the five aspects of service quality-analyzed in this research. The expected performances of the investigated aspects were higher than the perceived performance in the three hospitals, which show participants were not satisfied with the current quality of service offered in public and private hospitals.
The management of government hospitals should create strategies to increase its reliability and responsiveness. Analytical results showed a significant gap between perceived and expected reliability and responsiveness. Government hospitals will increase patient satisfaction and profitability by improving these aspects of service quality. Private hospitals should increase their assurance abilities. Assurance was identified as the most critical measure of service quality. Therefore a wide gap between perceived and expected assurance level is critical for private hospitals. Private hospitals can enhance patient satisfaction and profitability by creating strategies to improve assurance. The analysis showed that private hospitals focus on improving the physical aspect of their system. The low scores in aspects, such as responsiveness and reliability, show the need for improved healthcare management. Reliability and responsiveness are characteristics of employee behavior and the management of UAE hospitals should facilitate employee development through seminars, trainings, courses, and active ethical principles.
Conclusion
The efficiency of the health care system of any country, controlled by various elements, contributes to societal development. Service quality is related to patient satisfaction and profitability in the healthcare system (Zineldin, 2006). This research investigated how hospital system aspects affect service quality. An integrative research method, comprising secondary and primary data, was used for this study. Secondary data were obtained through peer-reviewed journals and articles related to the subject of service quality in healthcare systems. Primary data were derived by distributing questionnaires to a sample of patients across three UAE hospitals. The participants’ responses were coded in Microsoft Excel and analysed using Statistical Package for Social Sciences (SPSS). The outcome of the analysis shows that “assurance” has the greatest effect on the service quality of the healthcare system. To enhance service quality, government hospitals should increase responsiveness and reliability through staff development programs, while private hospitals should increase assurance.
References
Dey, P, Hariharan, S, & Brookes, N 2006, ‘Managing healthcare quality using logical framework analysis’, Managing Service Quality, vol. 16 no. 2, pp. 203-222.
Ovretveit, J 2004, ‘Formulating a health quality improvement strategy’, International Journal of Health Care Quality Assurance, vol. 17 no. 3, pp. 368-376.
Ramachandran, A & Cram, N 2005, ‘Standards and customer satisfaction in the healthcare industry’, Journal of Clinical Engineering, October/December, vol. 23 no. 12, pp. 219-228.
Westway, M, Rheeder, P, Van Zyl, D, & Seager, J, 2003, ‘Interpersonal and organisational dimensions of patient satisfaction: the moderating effects of health status’, International Journal for Quality in Health Care, vol. 15 No. 4, pp. 337-44.
Ygge, B, & Arnetz, J 2001, ‘Quality of paediatric care: application and validation of an instrument for measuring parent satisfaction with hospital care’, International Journal for Quality in Health Care, vol. 13 no. 1, pp. 33-43.
Zineldin, M 2006, ‘The quality of health care and patient satisfaction: an exploratory investigation of the 5Q model at some Egyptian and Jordanian medical clinics’, International Journal of Health Care Quality Assurance, vol. 19 no. 1, pp. 60-92.