Executive Summary
This business report provides an analysis and evaluation of Slowtel’s performance over the last three years of operation. In addition to discussing the current and prospective states of operational and financial management of the hotel, the report outlines its strategic and marketing directions. Internal and environmental dimensions of the company’s operations are evaluated with strategic capability and strengths, weaknesses, opportunities, and threats (SWOT) analyses.
The report draws attention to the fact that during the period of operations, management of the hotel developed and successfully implemented a set of strategic and financial decisions that resulted in the attainment of a sustainable competitive advantage. A relative market share was increased from 16.7 percent in year zero to 22.8 percent in the third year. Furthermore, net income totaled to $5,935,986 at the end of the third year, which is a remarkable result when compared to $699, 913 of net loss at the beginning of the operation. It is expected that both the business share and profitability will grow during the next two years.
Based on the analysis of performance to the date, the report finds that Slowtel’s financial and operational prospects are positive. The results of the financial analysis suggest that the management team approached its critical task with a deep understanding of organizational values. At the core of these values is a desire to deliver the best services to the delight of all Slowtel’s guests. The emphasis on authenticity propelled the team to launch a comprehensive refurbishment program that in addition to providing visitors of the hotel with memorable experiences, helped to maximize its present net value.
This and other capital expenditures were followed by an increase in revenues. Specifically, by investing $491, 537 in the refurbishment of conferences, the hotel garnered additional $1, 636, 324. Over the period of operation, a maintenance budget was decreased from $438, 972 to $404, 135. However, the reduction of the maintenance expenditures did not come at the expense of customer contentment, which is evidenced by a 4.44 percent increase of satisfaction levels at the end of the first year. Staff satisfaction levels were also improved by the end of the management period. The new management approach translated into a substantial reduction of turnover rates. The owner of the hotel is recommended to continue the partnership with the management team because its members are capable of improving the future direction of the hotel, which is evidenced by the report.
Operation Management
Operating Results
Changes in the gross operating profit (GOP) over the last three years illustrate the effectiveness of the new management team. Table 1 shows GOP for the period of operation and projection for the next two years.
Table 1. GOP (5 years).
- GOP grew from 16.15 percent at the start of operation to 59.86 percent in the third year.
- GOP are expected to increase by approximately 3 percent in year 4 and year 5.
- Total revenue from all departments of the hotel increased from $3,271,730 in year zero to $12, 051, 563 at the end of the third year, which demonstrates the effectiveness of implemented management strategies.
Figure 1 shows operational successes in terms of average room rates (ARR).
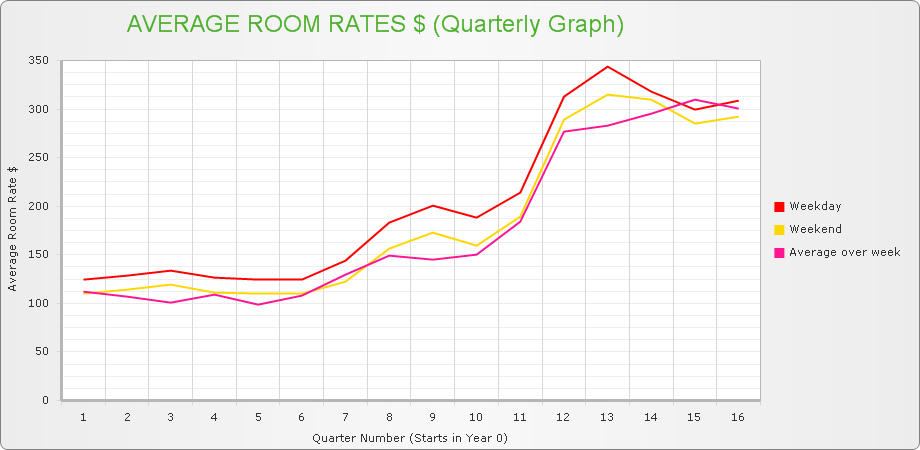
It is clear from the graph that ARR grew from approximately $106 in year 0 to $295 in year 3.
- Year-to-year ARR variances constituted 14. 07 percent, 33.74 percent, and 36.83 percent.
- The management expects ARR to reach $340 by year 4 and $370 by year 5.
Figure 2 and Table 2 illustrate operational results of the hotel in terms of revenue per available room (RevPAR) and occupancy rates.
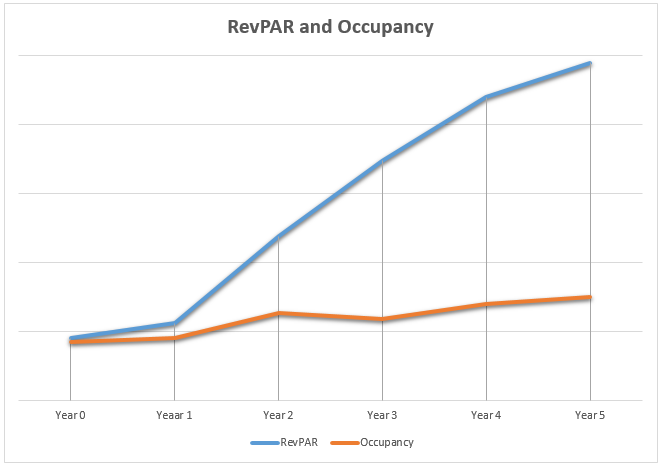
Table 2. RevPAR and occupancy.
- Room occupancy increased from 42.3 percent at the time of the contract initiation to 59 percent by the end of the third year, which constitutes 16.7 percent.
- The occupancy rate is expected to grow during the next two years and reach 75 percent by the fifth year.
The indicator averages indicate the effectiveness of the management team’s performance over the period under discussion. A consistent incline of all rates suggests that the implemented strategies will result in the increased performance in the following years.
Staffing Levels
During the last three years, the management attempted to control one of the largest variable expenses in Slowtel—labor costs. To this end, it was necessary to evaluate ongoing staffing needs as well as create a dependable estimate of future working capital needs (Okumus, Altinay, & Chathoth, 2010). Due to budgetary restrictions, the management of the hotel ensured that the accommodation of working capital needs did not diminish the overall profitability of the organization.
However, the team was also cognizant of the fact that appropriate staffing levels are a function of multiple factors estimation of which allows avoiding working capital gaps and surpluses (Guilding, 2014). The calculation involved projected daily room sales, employee availability, turnover rates, and quality indicators. Figure 3 and Table 3 show staffing levels as a percentage of revenue.
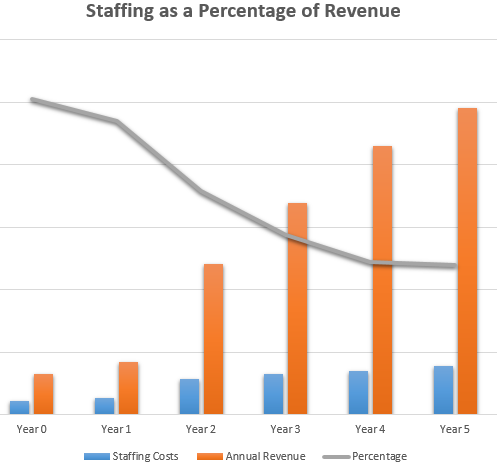
Table 3. Staffing levels as a percentage of revenue (5 years).
- The growth of staffing costs was associated with the increase of a training budget.
- Slowtel hired additional employees in all areas of operation to support the expansion of the business.
- The graph reflects the fact that a moderate percentage of revenue was allocated to staffing expenditures each year.
- The current staffing level matches business demand.
- It is projected that revenue percentage will decrease to 15.92 percent by the fifth year.
The increase in the positive cash flow allowed reviewing staffing decisions after the first year, which led to the hiring of additional employees. The management decision increased staff satisfaction by 25.32 percent and guest satisfaction by 4.44 percent during the first year of operation. Despite a reduction in the guest satisfaction level by 4.08 percent in the third year, the management team is certain that it will rise during the fourth and fifth years.
Staff Training Budget
Numerous lines of investigation point to the bi-directional link between staff training and employee turnover intentions (Kong, Cheung, & Song, 2012). Particularly, by implementing active career management activities such as training, it is possible to increase employee satisfaction, which reduces turnover rates (Kong et al., 2012). In addition to the fulfillment of employee development needs, appropriate staff training programs help improving customer satisfaction (Torres & Kline, 2012). Therefore, during the three years of operation, the management team made sure that training budgets were steadily and substantially enlarged. Figure 4 and Table 4 show the relationship between annual costs of staff training, staff satisfaction, and guest satisfaction
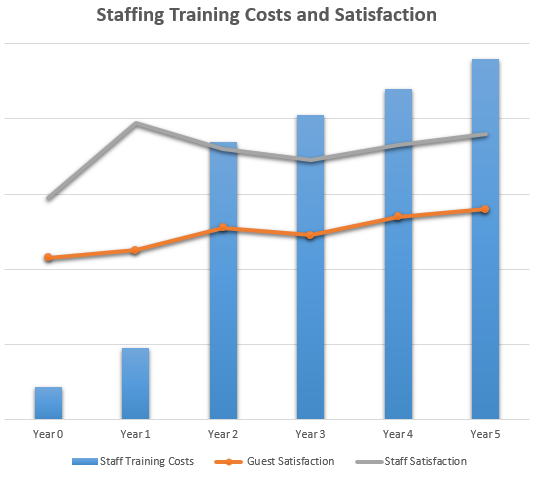
Table 4. Annual staff training costs, staff satisfaction, and guest satisfaction.
- It is evident from the graph that the expansion of the training budget costs was associated with the increase of staff satisfaction from 59 percent in the first year to 69 percent in the third year.
- The level of guest satisfaction also increased during the three years.
- The levels of staff and guest satisfaction are expected to rise in the next two years.
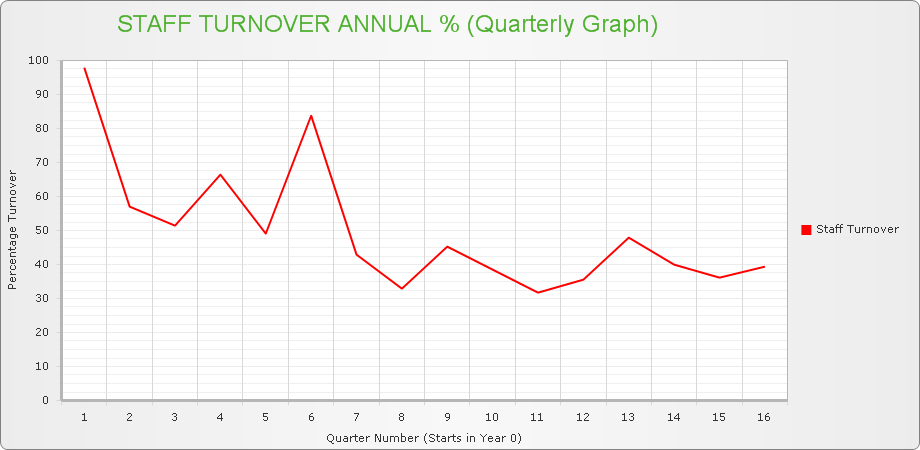
Turnover rates markedly decreased by the last year of the contract, which is evidenced by Figure 5.
Refurbishment Program
Substantial refurbishments were conducted in August of the first year of operation. The front desk, the bar, and eighty standard rooms in the hotel were refurbished. The decision was dictated by the need to maximize the organization’s net present value (NPV) (Kim, Li, Han, & Kim, 2017). To show the empirical improvements of the refurbishment program, it is necessary to conduct a cost-benefit analysis.
- Over the period of three years, conferences provided the hotel with additional $1, 636, 324 in revenues.
- The cost of refurbishment for the conference rooms was $491, 537.
- This item of the refurbishment program helped the hotel to earn $144, 787.
Given that the investment was associated with the large return, it is evident that this particular aspect of the refurbishment program was successful. After conducting cost-benefit analyses for rooms that were renovated during the second year, it can be stated that the whole program benefited Slowtel. According to Bloom (2012), refurbishment is bi-directionally connected to both profitability of a hotel and guest satisfaction. It means that the temporary sacrifice of the hotel’s profitability was economically justified.
Maintenance Program
To satisfy ever-rising expectations of the hotel users, a comprehensive maintenance program was developed and implemented. The program involved both preventive and corrective maintenance measures that are performed by registered contractors under the supervision of the hotel’s staff (Lai & Yik, 2012).
- During the first year of operation, the maintenance budget was decreased from the previous year’s level—from $438, 972 to $404, 135.
- The maintenance spending was doubled during the second year, which allowed reducing the hotel’s downtime and improving the customers’ satisfaction.
- During the third year, the diminished maintenance demand justified the reduction of the maintenance budget from $1, 091, 982 to $1, 070, 522.
- For the next two years, the budget will remain at the base level of the third year.
Financial and Operating Results
Evidence of Cost Control Systems
Keeping expenses low is essential for the hospitality industry, in general, and Slowtel, in particular; therefore, a comprehensive energy management (EM) program was adopted by the management of the hotel (Klychova, Faskhutdinova, & Sadrieva, 2014; Lai, 2016). The program presupposes the use of energy saving “heating, ventilation, air conditioning (HVAC), refrigerating and other equipment, and artificial lighting systems” (Lee & Cheng, 2016, p. 761). The implementation of the program along with the identification of cost saving opportunities allowed curbing energy expenses. Figure 6 and Table 6 show operating and energy costs as a percentage of revenue.
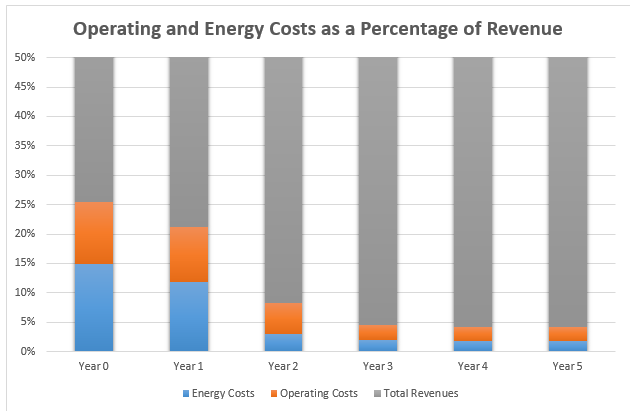
Table 6. Operating and energy costs as a percentage of revenue.
- Average energy costs during the first year of operation were almost equal to average energy costs during the third year of operation—$12, 592 and $12, 697, respectively, which shows the effectiveness of cost containing measures.
- At the same time, the number of available rooms increased from 45, 860 at the beginning of the first year to 67, 340 at the end of the third year.
- The effectiveness of cost control measures is also underscored by the reduction of the percentage of operational expenses (Enz, 2011; Saksonova & Savina, 2016).
Interpretation of Financial Results
Table 7 presents a summary of income statement.
Table 7. Income statement.
- Total revenue was $3, 271, 730 in the first year to $16, 914, 398 in the third year.
- Unfortunately, the first year was associated with a net loss.
- It is expected that by the end of the fifth year, revenue and profit will reach $24, 500, 000 and $10, 000, 000, respectively.
Balance Sheet
Table 8 demonstrates a balance sheet of Slowtel.
Table 8. Balance sheet.
- By the third year, the hotel managed to increase its current assets.
- Long-term debt was reduced to a significant degree—$1, 725, 100
- In two years, the debt will be decreased to $900, 000.
Cash Flow
Table 9. shows a summary of the company’s cash flow.
Table 9. Cash flow.
- Net cash derived from operating activities of Slowtel grew from $482, 060 to $8, 655, 702 during the management period.
- The management team also helped to increase a cash balance from $362, 092 to$4, 578, 633.
- The hotel’s exploited expansion opportunities during the first and second years of operation; therefore, it had a credit balance (Turner, 2017).
Conclusions, Recommendations and Justifications
The business report analyzed the operation of Slowtel over the last three years in order to reassure the capability of the management to improve its performance during the following years. The report discussed strategic and marketing directions of the hotel as well as internal and environment dimensions of the business. Based on the evidence from the financial report and key operational indicators, it was argued that the management actions in their entirety had helped to earn the substantial profit after the four quarters of the net loss ($345, 419). The analysis of the current results indicates that the hotel’s financial and operational prospects for the next two years are positive, which justifies the continuation of the contract.
Even though the period was extremely successful, the hotel failed to keep up with the expansion of the market, which is evident by the reduction of the market share at the end of the third year (13.6 percent). In addition, public awareness marginally diminished over the three years (38.68-34.47). Therefore, it is recommended to increase social media presence and the advertising budget during the next two years. In addition, it is also necessary to strengthen partnership with OTAs, focus on customer relationships, and review rate decisions.
The management team implemented several cost containment initiatives, which allowed to ensure that annual operating expenses did not exceed 30 percent of total annual revenues. Furthermore, the use of energy saving devices was essential for reducing energy costs to less than one percent of total annual revenues. Innovative cost reduction strategies along with effective revenue management translated into a strong financial performance of the organization.
Total revenues generated during the period of operation were increased by approximately one million from $3, 271, 730 in year zero to $4, 231, 440 in the first year. Despite the fact that the four quarters of year zero were associated with net losses and extremely low revenues, profits steeply climbed in the second year and reached $3, 042, 972. By the third year, the hotel generated $5, 935, 986. It is expected that profits will amount to $10, 000, 000 in two years. Taking into consideration a steady growth in revenues, customer satisfaction, and other key performance indicators, the owner of the hotel would be justified in extending the contract. By doing so, they will ensure that the business excels in the marketplace characterized by a high level of competition.
References
Bloom, A. N. B. (2012). The relationship among guestroom renovation, customer satisfaction, and profitability. The Journal of Hospitality Financial Management, 20(1), 97-104.
Enz. C. A. (2011). Hospitality strategic management: Concepts and cases (2nd ed.). Hoboken, NJ: Wiley.
Guilding, C. (2014). Accounting essentials for hospitality managers (3rd ed.). Abington, England: Routledge.
Kim, W. G., Li, J., Han, J. S., & Kim, Y. (2017). The influence of recent hotel amenities and green practices on guests’ price premium and revisit intention. Tourism Economics, 23(3), 577-593.
Klychova, G. S., Faskhutdinova, M. S., & Sadrieva, E. R. (2014). Budget efficiency for cost control purposes in management accounting system. Mediterranean Journal of Social Sciences, 5(24), 79-83.
Kong, H., Cheung, C., & Song, H. (2012). From hotel career management to employees’ career satisfaction: The mediating effect of career competency. International Journal of Hospitality Management, 31, 76-85.
Lai, J. H. K. (2016). Energy use and maintenance costs of upmarket hotels. International Journal of Hospitality Management, 56, 33-43.
Lai, J., & Yik, F. (2012). A probe into the facilities maintenance data of a hotel. Building Services Engineering Research & Technology, 33(2), 141-157.
Lee, D., & Cheng, C. C. (2016). Energy savings by energy management systems: A review. Renewable and Sustainable Energy Reviews, 56, 760-777.
Okumus, F., Altinay, L., & Chathoth, P. K. (2010). Strategic management for hospitality and tourism. Oxford, England: Butterworth-Heinmann.
Saksonova, S., & Savina, S. (2016). Financial management as a tool for achieving stable firm growth. Economics & Business, 29(1), 49-55.
Torres, E. N., & Kline, S. (2012). From customer satisfaction to customer delight: Creating a new standard of service for the hotel industry. International Journal of Contemporary Hospitality, 25(5), 642-659.
Turner, M. J. (2017). Precursors to the financial and strategic orientation of hotel property capital budgeting. Journal of Hospitality and Tourism Management, 33, 31-42.