Introduction
Elastic materials stretch proportionately with increase in mass provided that the elastic limit is not exceeded. This forms the basis for Hooke’s law which states that: for elastic bodies, the stretching force (F) is directly proportional to the extension (d) provide that the elastic limit is not exceeded. Hence, the essence of performing this experiment was to ascertain this principle for both a rubber band and a spring (Lewin 14).
In this experiment both the rubber band and the spring were separately subjected to corresponding stretching forces and the information tabulated for analysis. A graph of d was plotted against F (separately) to obtain a linear fit and the static spring constant (Ks). Using the spring that was set to oscillate along the vertical axis, the period squared (T2) versus the mass (m) were plotted and then analyzed. From this graph the dynamic constant (Kd) was obtained and compared with Ks of the spring (they ought to be equal).
The result revealed that ‘Ks’ (41.62± 0.34 N/M) was approximately equal to Kd (40.0±0.0234 sec2/g). This showed discrepancy of 4.05% that might be due to experimental errors. The Ks of the rubber was found to be 23.26 ±3.26 N/m. This reveals that the spring is stronger than the rubber band. From the analysis, the effective mass of the spring was 0.031gm. The uncertainties might have been due to experimental design that might have limited the obtaining of accurate values of T (by the aid of the eye). In future experiments, this can be minimized by computerizing the whole experiment
Objective of the experiment
The main objective of performing this experiment is to validate the relationship between the force and the extension of a spring with respect to Hooke’s law to obtain the static spring constant. Also, alongside this objective, the dynamic spring constant was derived from the relationship courtesy of simple harmonic motion of a spring.
Procedure
In this experiment, a spring was loaded with masses ranging between 100 and 700gms in ascending order. The values of displacement, x, and the force, F, were momentarily recorded in steps. Upon reaching the maximum mass, the spring was off-loaded in the very order of loading as their respective values of x were being recorded. The values of the displacement against the force were then plotted to obtain the static spring constant. This procedure was repeated with the rubber band replacing the spring.
Using a 500gm mass, the periodic time, T, were tabulated for different amplitudes, x. Using a nominal amplitude of between 1 and 2 cm, the periodic time and their corresponding masses (between 200 and 600gms) were tabulated for analysis.
Results
The results for this experiment were:
From the relationship between the displacement (d) and the force (F) for the rubber, the static spring constant (Ks) was equal to 23.26 ± 3.26N/m. Ks for the spring was equivalent to 41.62± 0.34 N/M. the dynamic constant (Kd) for the spring was equivalent to 40.0±0.0234 sec2/g. The uncertainty in Kd of the spring with respect to Ks of the spring was equivalent to 4.05%. The effective mass (mo) of the spring was 0.0314 gm.
Data analysis
Table 1 below shows the values obtained when varying the mass
Table 2 below represents the data obtained from the experiment.
Table 2
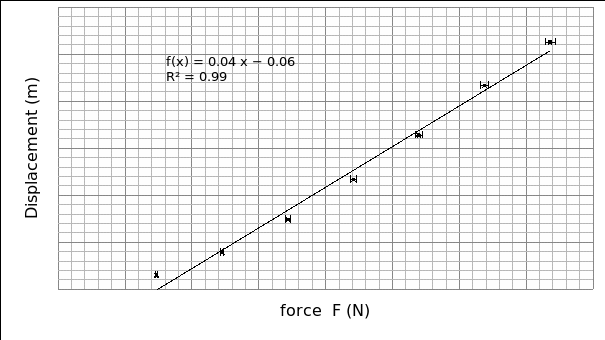
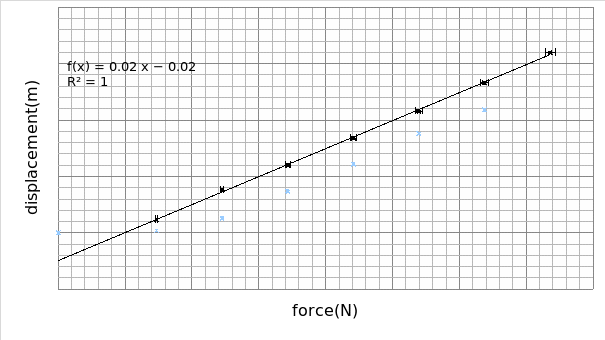
On plotting the data of table 1, the below trends are observed.


From graph 1, the relationship displacement d and the force F assume a linear plot that is believed to be connected by the formula: ΔF = KsΔd.
Where, Ks is the static spring (rubber band) constant, d is the displacement and F is the stretching force.
Rearranging the formula, we obtain: Δd=ΔF/Ks.
Therefore, the slope of the graph will give us the reciprocal of static spring constant. Hence, Ks =1/0.043
=23.26 ± 3.26N/m
Uncertainty in Ks = 1/ 0.043-1/ 0.05 =3.26 N/m.
We therefore conclude that the static rubber band constant is equal to 23.26 ± 3.26N/m. the rubber band obeys the Hooke’s law since the value of the force is directly proportional to the displacement.
As regards the spring, Ks=1/ slope =1 /0.024
=41.62± 0.34 N/M
Uncertainty in the value of Ks of the spring= 1/0.024-1/0.0242 ≈ 0.34
We therefore conclude that the Ks of the spring is equivalent to 41.62± 0.34 N/M. from the graph we can tell that the spring obeys the Hooke’s law. This is so because the value of the force increases proportionately with the displacement. Comparing the two materials, it is evident that the spring is much stronger than the rubber band since Ks of spring (41.62± 0.34 N/M) is greater than Ks of the rubber (23.26 ± 3.26N/m).
From the equations, ω^2=Kd/ (m+mo) and ω=2π/T, a relationship between T^2 and m can be derived. Combining the two you obtain:
4π/T^2=Kd/ (m+mo)
Kd is the dynamic spring constant,
m is the hanging mass,
T is the periodic time and,
ω is the angular velocity.
Rearranging the equation you get:
T=2π√ ((m+mo)/Kd)
Squaring on either side you obtain:
T^2=4π^2m/Kd+4π^2mo/Kd
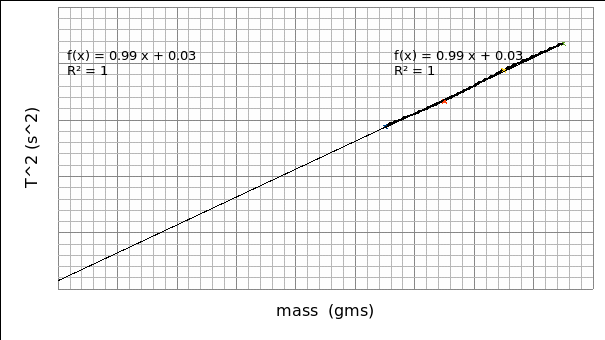
Therefore, the graph of T^2 against m should be a linear graph where:
Slope (S) = 4π^2/Kd and,
Y-intercept=4π^2mo/Kd
Hence, the value of Kd is given as below:
Kd= 4π^2/slope =4*3.142^2/0.987
=39.999≈40.0±0.0234 sec2/gm
The uncertainty in the value of Kd is given by;
Uncertainty (Kd) = Δslope/slope=0.02312/0.987=0.0234
The value of Kd (40.00) is almost equal to the value of Ks (41.62) of the spring. The discrepancy between these values is given by:
(41.62-40.00)/40.00* 100 = 4.05%
From the graph, mo = Kd *Y intercept/ (4π^2)
=39.999*0.031/ (4*4.314^2)
=0.0314 gm.
From the equation, T^2=4π^2m/Kd+4π^2mo/Kd, when the value of T^2 =0 then m=mo. The variable, m, is the mass of the spring and is the m axis intercept. Therefore, m is approximately equal to 0.314gm.
We therefore conclude that the dynamic spring constant (Kd) is approximately equal to 40.0±0.0234 sec2/gm. This value is approximately equal to the static spring constant (Ks) (41.62± 0.34 N/M). The value of effective mass of the spring (mo) is equal to 0.314 gm.
Discussion
The objective of performing this experiment was to ascertain whether the rubber or the spring obey Hooke’s law. Moreover, the experiment wanted to ascertain the relationship between dynamic constant of a spring and the static constant of a spring. According to Hooke, for elastic materials, the force is directly proportional to the extension provided the elastic limit is not exceeded. In this experiment, for both the spring and the rubber band, they obeyed Hooke’s law (ΔF = KsΔd). The constant of proportionality (Ks) determines the strength of elasticity i.e. the strength of the material increases with the value of Ks. This is obtained from the gradient of the graph. It can be deduce that the spring (Ks=41.62N/M) is stronger than the rubber (Ks=23.26N/M).
Basically, the value of Ks for a material should be the same as Kd of the same material. Kd is obtained from an equation combining parameters when set to oscillate. With regards to the spring, Kd (40.0±0.0234 sec2/gm) and Ks (41.62± 0.34 N/M) were approximately equal were it not for experimental errors. The discrepancy was 4.05%. The value of mo (0.314gm), the effective mass of the spring should be one third that one for the ruler. However, from graph 2 when the loaded mass m is zero, the graph exhibits the mass of the spring (displacement intercept) as negative. This could be due to experimental error.
The uncertainties that might have dispersed the data could have been contributed by experimental design. One inevitable error with respect to oscillating bodies that might have dispersed the data could be due to inaccuracy in telling the periodic time (T). In future experiments, this error can be minimized by computerizing the experiment. Otherwise the experiment achieved the objective in line with Hooke’s law.
Conclusion
From the experimental analysis, it can be deduced that the objective of the experiment was achieved with both the rubber and the spring behaving in line with Hooke’s law. This is so because from the graphs drawn, a straight line with a positive gradient was obtained indicating that it is a direct proportion relation.
Work Cited
Lewin, Walter. Hooke’s Law, Simple Harmonic Oscillator. Cambridge: Cambridge University Press, 2010. Print.