Introduction
Stability of structures deals with forces acting on a particular structure, on the various components of the structure; how such forces are, or could cause a push or a pull on the structure. Otherwise, ‘stability of simple frames’ simply puts it that stability of the structure is concerned with establishing the position of a structure against failure, against collapse (Adina 2007, p. 14). This write-up presents an analysis of a frame shown in Figure 1. In analyzing the frame, the account is taken of the effect of axial load on the flexural stiffness of compression members.
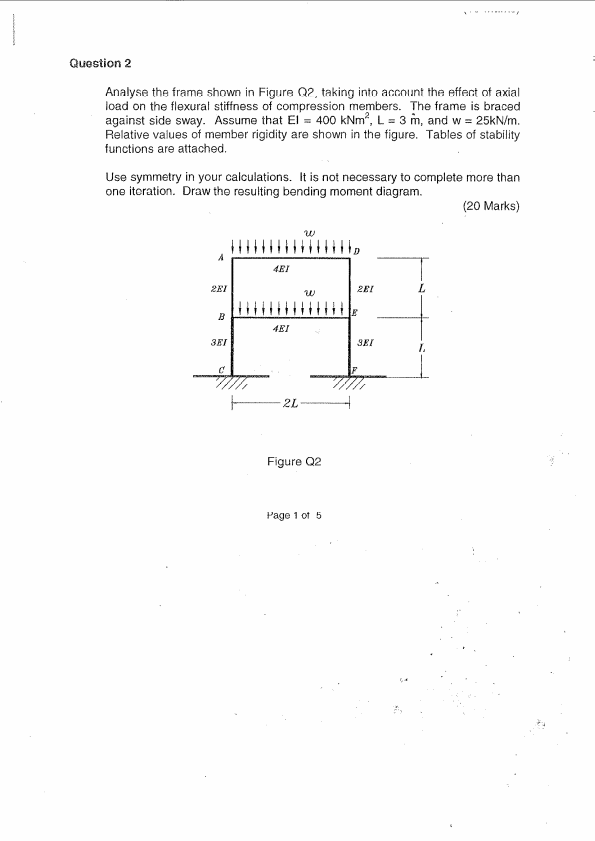
t is noted in the question that the frame is braced against side sway, and that flexural stiffness, EI= 400 kNm2, L= 3 m, and W= 25kN/m. Symmetry is used in the calculations and a bending moment diagram (BMD) is produced.
Symmetrical Frame
The symmetrical frame for the structure in Figure 1 is produced in Figure 2. A roller is introduced at G and H to prevent the frame from swaying, and to put an end to the member. Moment distribution of the symmetrical frame is considered. The analysis of the frame using iteration is adopted, as suggested for similar structures by Kange (2004, p.43). The fixed-End moments of the members shall now be analyzed.
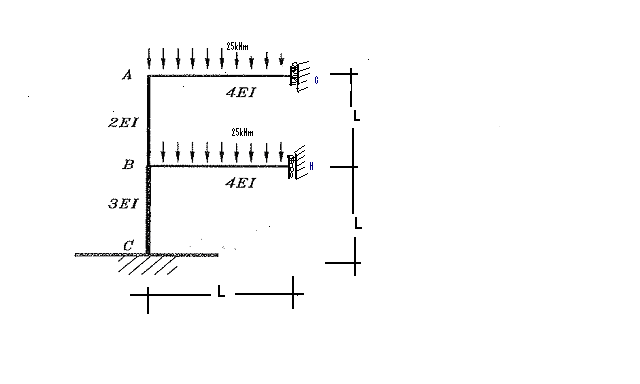
Fixed-End moments
Moment at A about B = MABF = – MBAF = WL2 /12 = 0 … W= Load.
MBCF = – MCBF = WL2 / 12 = 0.
MAGF = – MGAF = 25 x 32 / 12 =18.75kNm, MBHF = – MHBF = 18.75kNm.
Column Stiffness (K)
KAB = 4EI / L = 4 x 2 x 400 / 3 =1066.67
KBC = 4EI / L = 4 x 3 x 400 / 3 = 1600.0
Beam stiffness (K)
KAG =4EI / L = 4 x 4 x 400 / 3 = 2133.33
KBG = 4 x 4 x 400 / 3 = 2133.33
Distribution Factor (D.F)
D.FAB = KAB / (KAB + KAG) = 1066.67 / (1066.67 + 2133.33) = 0.3333
D.FBC = KBC = KBC / (KBC + KAB + KBH) = 1600 / (1600 + 1066.67 + 2133.33) = 0.3333
D.FAG = KAG / (KAG + KAB) = 2133.33 /(2133.33 + 1066.67) = ).6667
D.FBH = KBH / (KBH + KAB + KBC) = 2133.33 / (2133.33 + 1066.67 + 1600) = 0.4444
Philips (2008, p. 24) suggests a moment distribution table for a similar analysis. Thus a moment distribution table for the structure in figure 1 is as shown in Table 1.
Moment distribution table. Bending Moment Diagram (BMD).
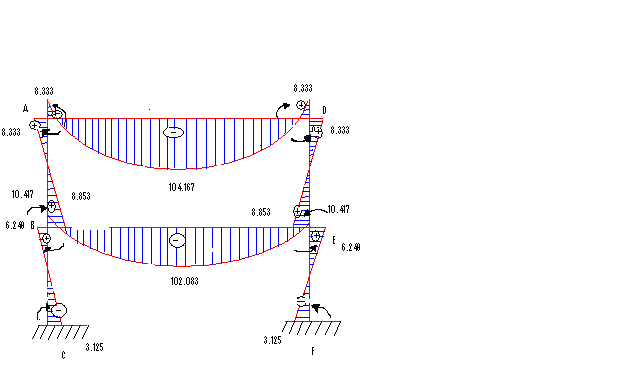
The BMD for the frame is shown below in Figure 3.
Span Moments
Span AD
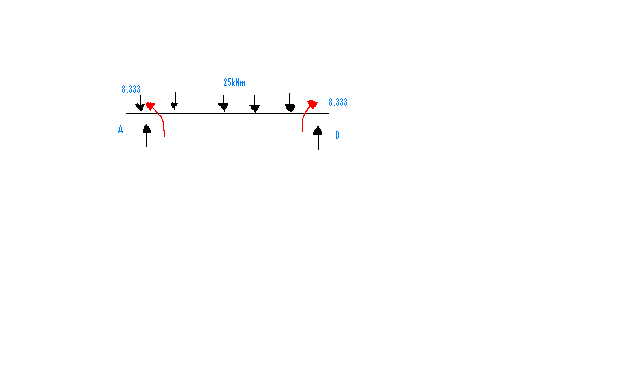
TA = 25 x 6 /2 + 8.333/6 – 8.333/6 = 75kN
MX = 75x -25x2 / 2 -8.333
d Mx /dx = 75 – 25x = 0
x =75 / 25 =3
Therefore, Mx =75 (3) – 25 (32) / 2 – 8.333
= 225 – 112.5 – 8.333
Mmax =104.167 kNm.
Span BE
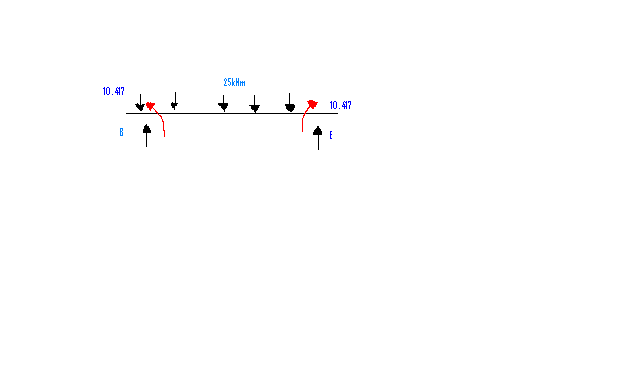
TB= 25 x 6 /2 + 10.417/ 6 + 10.417 / 6 = 75kN
Mx = 75x – 25x2 / 2 -10.417
d Mx / dx = 75 – 25x = 0, x => 0.
Therefore, 75 (3) – 25 (32) / 2 – 10.417
= 225 – 112.5 – 10.417 = 102.083 kNm
Conclusion
A frame given in Figure 1 above has been analyzed using symmetry. A Bending Moment Diagram for the reactions on the frame is produced in Figure 3. It should be noted that from the BMD, loao on AD most not exceed 104.167 kNm, and on BE not more than 102.083 kNm, otherwise the structure will fail.
Cited Works
Philips, D 2008, ‘Analysis of Bridges’, Aboki, 217, pp 23 – 24.
Kange, L 2004, ‘Causes of failure of structures in Nigeria’, Lan, pp 42 -44.
Adina, M 2007, ‘stability of simple frames’, Godman pp 14 – 15.