Introduction
Conducting statistical analyses for data collected at different points in time is a reliable tool for quantifying the behavior of variables. This paper uses data from the population of 269 Brazilian cities, which was counted in 1991, 2000, 2010, and 2014. By examining data behavior patterns for each year separately and in parallel analysis, it is possible to determine how Brazil’s population has changed over time (Census, 2023). The descriptive statistics used for this assignment allow us to identify measures of central tendency and variability, examine primary trends in distributions, and form an overall picture of population patterns for the country (Kaliyadan & Kulkarni, 2019). The findings prove helpful not only for those interested in practical applications of statistical tools but also for policymakers and decision-makers, allowing them to guide social and health policy vectors based on a quantitative approach.
Exploring the Four Years of Data
The Excel primary data document contains population records for Brazil’s 269 cities, measured over four inconsistent censuses. A legitimate first step in analyzing the data is to use descriptive statistics to determine if and how Brazil’s total population changed from 1991 to 2014. Table 1 contains the analysis results, including measures of central tendency and variability for each year; all values were calculated using the built-in functions shown in Appendix A.
Table 1: Results of Descriptive Statistics for Each Year
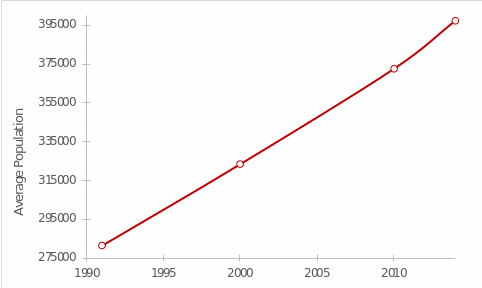
Based on the data in this table, it can be seen that the total and the average Brazilian population, measured for 269 cities, grew continuously from 1991 to 2014, as can also be seen in Figure 1. Using =SLOPE() for each pair of points reveals that the most rapid increase in average population was seen between 2010 and 2014 and was approximately 6196 people per year (CFI, 2023). The slope for the other pairs of points was between 4662 and 4902 people per year. In other words, Brazil’s average population grew most rapidly from 2010 to 2014. The pattern of population growth is also observed for the other instruments of descriptive statistics, whether median, range, standard deviation, or first and third quartiles, all of which grew steadily over the entire observation period.

Outlier Detection
Data distribution can have outliers, that is, extremely low or extremely high values outside the acceptable limits for a particular distribution. There are several methods for identifying outliers, such as IQR or Z-score, but this paper will use the Z-score method (Mahmood, 2022). The population averages for each year have already been calculated previously (Table 1), as well as the standard deviations.
Consequently, the task was to use the formula [1] to determine the Z-score of each city in each year: a total of 1,076 (269×4) Z-scores were to be obtained. However, due to the lack of population data for some cities in 1991, the final number of valid Z-scores was 1058 (269×4-18). The criterion for screening out is the Z-score outside the interval [-3,3], and applying conditional formatting to the Table allows finding all such values without error (Mahmood, 2022). Using such a method allowed us to find that Rio de Janeiro and São Paulo were outliers in all four years of measurement.

Correlation Analysis
Additionally, it was necessary to determine the correlation coefficient between the first year and all the other years, that is, to perform a pairwise correlation analysis. This analysis determines the strength and direction of the relationship between two continuous variables (Senthilnathan, 2019). Table 2 contains the analysis results: all correlation coefficient values are between—992 and 1.000, indicating strong positive relationships between the variables (Appendix B). Expectedly, the correlation between the two identical distributions (1991 and 1991) was 1.000; with the other years, the strongest relationship was with 2000 and went on to weaken somewhat. It follows that the correlation between the distributions weakened over time but was still extremely strongly positive.
Table 2: Results of Correlation Analysis
Conclusion
To summarize, it should be reiterated that statistical analysis is an appropriate and reliable strategy for examining patterns and relationships between data. This approach reduces bias and increases the accuracy of the conclusions, so it should be used for analysis. The statistical analyses in this paper showed an increase in the Brazilian population, both average and total, over four years. Rio de Janeiro and São Paulo were outliers in the data because their respective z-scores were out of the range [-3, 3]. In addition, the analysis showed positive, strong relationships between all distributions, but the relationship weakened slightly over time. Thus, all of the findings can be used by decision-makers to adjust social policies and make more intelligent interventions.
References
Census. (2023). Statistical research. United Stated Census Bureau. Web.
CFI. (2023). SLOPE function. Corporate Finance Institute. Web.
Kaliyadan, F., & Kulkarni, V. (2019). Types of variables, descriptive statistics, and sample size. Indian Dermatology Online Journal, 10(1), 82-86. Web.
Mahmood, M. S. (2022). Outlier detection (part 1). TDS. Web.
Senthilnathan, S. (2019). Usefulness of correlation analysis [PDF document]. Web.