Creating Visual Displays of Data
Descriptive Statistics for Festival.sav
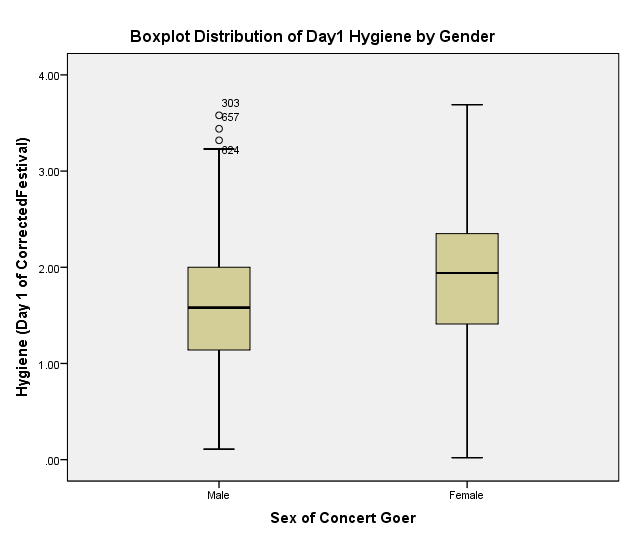
Gendered Boxplot for Day1 CorrectedFestival
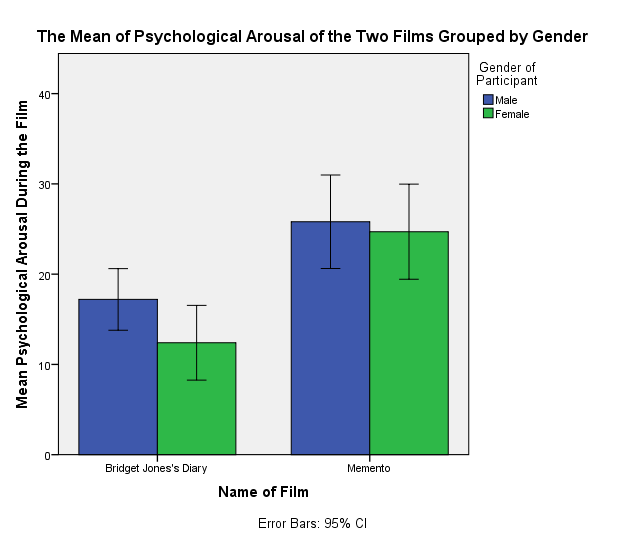
Bar Chart and Error Bars Created from Chick-Flick.sav
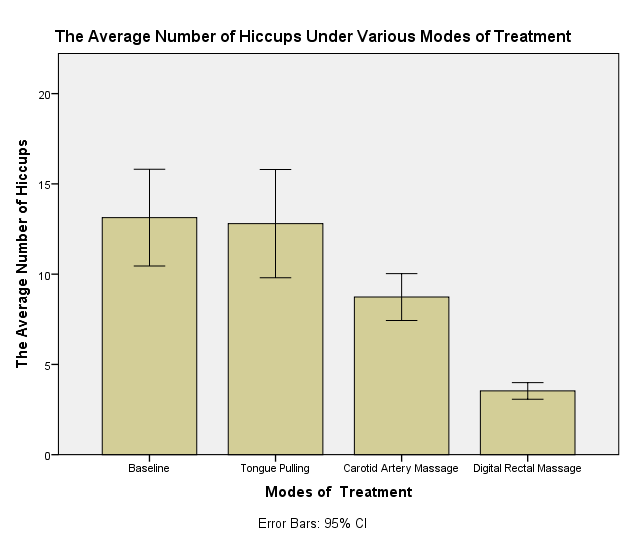
Bar Charts and Error Bars Created from Hiccups.sav
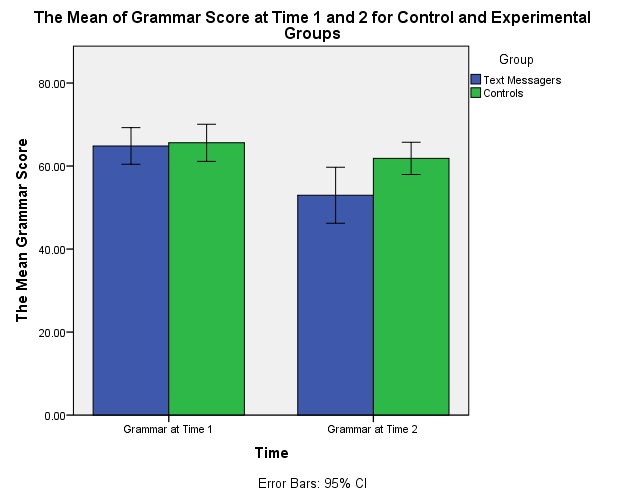
Clustered Bar Chart Created from TextMessages.sav
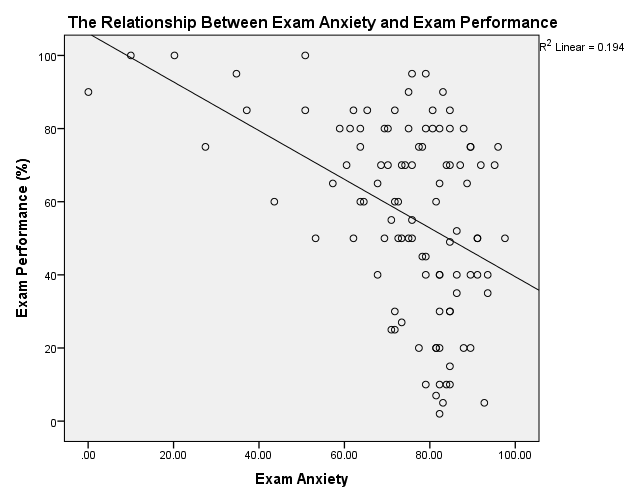
Scatterplot and regression line created from Exam Anxiety.sav
Exploratory Data Analysis
Exploratory data analysis (EDA) forms the basis of confirmatory statistical analysis because it plays a significant role in the characterization of variables, summarization of data, and visualization of patterns and trends. According to Wickham and Grolemund (2017), summarizing, visualizing, transforming, and modeling are major methods employed in EDA. One of the reasons for performing EDA is to check for errors to confirm the existence of expected values, distributions, and relationships. Common errors emanating from typos create missing values and transposition errors, which distort the nature of the distribution of data and relationships between variables. In this view, EDA methods, such as boxplots, normality plots, scatterplots, symmetric analysis, and correlation analysis, aid in checking errors in data. Checking for assumptions is another reason for undertaking EDA before confirmatory statistical analysis. Since confirmatory statistical analysis requires data to meet specific assumptions, checking for assumptions using EDA is critical to ensure the validity of findings. EDA tests of measurement scales, normality, multicollinearity, homoscedasticity, and homogeneity of variances are ordinary tests of statistical assumptions.
The third significance of EDA is a summarization of data to reveal important information regarding patterns and trends of distributions. For example, statisticians normally use descriptive statistics in summarizing data. Downey (2015) explains that descriptive statistics constitute measures of dispersion and central tendency, which provide a substantial summary of patterns and trends of data. Through descriptive statistics, statisticians can establish the magnitude and scope of each variable, and make informed interpretations of inferential statistics. The fourth importance of the EDA is that it permits the preliminary selection of appropriate tools in the design and formulation of statistical models (Wickham & Grolemund, 2017). For instance, regression analysis needs the selection of an appropriate model that predicts relationships between variables of interest. The stepwise method of regression analysis is an iterative procedure of EDA, which sequentially selects significant variables and eliminates insignificant predictors.
The fifth benefit of EDA is the selection of appropriate tools and techniques for data collection and analysis. Cluster analysis and dimension reduction are examples of EDA methods that assess the validity of questionnaires and variables used in data collection (Downey, 2015). Cluster analysis eases data analysis because it categorizes variables into groups with similar and differentiated variables. Since raw data has many redundancies, dimension reduction eliminates redundant variables and creates principal variables, which explain most of the variations in data. Thus, EDA ensures that research instruments generate not only valid but also reliable data for meaningful inferential statistics.
References
Downey, A. (2015). Think stats. Sebastopol, CA: O’Reilly Media.
Wickham, H., & Grolemund, G. (2017). R for data science: Import, tidy, transform, visualize and model data. Sebastopol, CA: O’Reilly Media.