Statistical process control is the use of statistics to supervise and manage a certain process in order to be sure that it operates to its maximum capability thereby producing results that conform to the required standards.
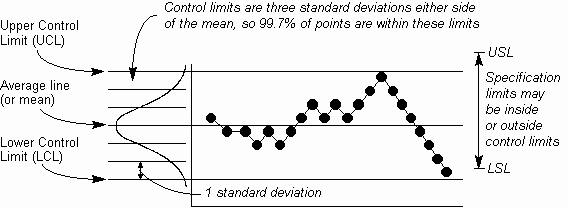
In addition, control limits are horizontal lines that are drawn to scale, a distance of ±3 standard deviation of the statistics collected from the standard mean on statistical process control charts.
Once they are drawn, the charts are used in the detection of signs that show that a given process is not in control as it ought to be. By detecting such errors, one maybe able to know which projects are not behaving as predicted (Hogg, 2005).
The signals used in the process control are known points which are outside the control limits. In projects that have statistics that are distributed normally, the area that is bracketed by the control limits will contain 99.72% of all the plotted points on a given chart if the process is in statistical control and does not change from that position.
On the other hand, a false-detection rate will normally be at a 0.28% rate. The data used in the statistics is usually collected from random data sources from different groups of a given product; this is known as stratified sampling.
The random data is collected at the different stages in production process by use of inspection techniques. Once the data has been collected, the information is transferred to a control chart where it is used in plotting the data points (Stamatis, 2002).
In addition, one has to make a distribution chart which will be used to group the collected data together. The variable data is the taken into sample sizes of 2 to 5 thereby enabling the data to have a specific range, known as R-Bar, and a mean known as, X-Bar.
The range assists is determining by how much the process has shifted from the normal course. The X-Bar is got from a summation of the total measurements and dividing it by the number of the total sub-groups. When collecting the data sample, one has to be sure that the data represents the population size hence making the statistics more credible.
Therefore, if we were to take a sample size of 60, it would be divided into two sub groups of 30 observations and 6 sub groups of 10 observations. The observations are important since they provide a reference for use in the creation of the factor table used in determining the control limits.
After determining the control limits we add 1 sample size of the number of the sample sizes observations we have at hand.
When making the control charts one should use the X-Bar and Range charts to determine the upper and lower control limits which normally range between ±3 from the double X-bar. These control limits can be got from the chart as follows (Oakland, 2008).

Seasonal factors usually affect the results from the analysis of any data collected. Since the data is seasonal, it is not permanent and thus prone to changes. The change in factors could be due to seasonal adjustments in the environment for example, price changes due to holidays.
Thus, once the changes have taken place, the data sample changes resulting in a different result and a shift in the control limits. In addition there is an effect known as, trend shift. This is change in data sample resulting in having inaccurate adjustments of the control limits since the data collected is distorted.
Trend shifts normally occur when a frequent occurring event suddenly starts to occur sporadically at irregular occurrences thereby changing the pattern of data samples (Doty, 1996).
Confidence intervals are the given analysis used to determine the reliability of given statistics. The confidence interval is got from the values found between the upper control limit and the lower control limit.
This range represents the mean of the sampled population which is normally ascertained initially. After that the degree of the expected confidence interval is specified and is normally, 1- alpha. 1 – Alpha represents the accepted risk of data being wrong or inaccurate. The population standard deviation, sigma is known as the rarety.
In determining the confidence levels, if the variance of a given population sample is not known, the confidence level can be determined by use of t-distribution as follows, where t= t value with n-1 degrees, where the sample is 1-sample or n1 + n2 – 2 degrees of freedom in a 2-sample test.
The advantage of using t- distribution instead of other distributions formulae for example, z- distribution is that the data used is assumed to have come from a population which is distributed normally unlike in the z-distribution, where the data used is not (Black, 2009).
Process improvement is the reduction of variations of the mean thus making the data reliable in the statistics. Process improvement can be done by statistical process control whereby, the user of the data can supervise, make analysis and control the process freely thereby ensuring that the data collected is very accurate and not interrupted by other factors in the course of the process.
However not all data will respond in the desired way thus one has to take into account data that is inconsistent with the rest. These type of data is referred as tolerances and is used in judging if a product is acceptable or not thus, by so doing the process incorporates the flexible manufacturing system.
Reference list
Black, K. (2009). Business Statistics. Hoboken, NJ: John Wiley and Sons.
Doty, L. (1996). Statistical process control. New York, NY: Industrial Press Inc.
Hogg, R. (2005). Introduction to Mathematical Statistics. Upper Saddle Rvr, NJ: Pearson Education.
Oakland, J. (2008). Statistical Process Control. Woburn, MA: Butterworth-Heinemann.
Stamatis, D. (2002). Six Sigma and Beyond, Statistical process control. Cambridge, MA: CRC Press.