Introduction
Stock markets all over the world provide platforms for people to trade and conduct business on all the stocks listed under these platforms. The US stock exchanges are some of the most active in terms of trade and investors. As a result, this essay is going to analyze two US based companies trading in the NYSE (New York Stock Exchange) and two foreign companies also trading in the same exchange. The paper will analyze the performance of these stocks over a period of four months through use of different techniques. The American companies that will be analyzed are Pfizer and Google, while international companies will be Tata Motors and Samsung Electronics.
Analysis
The analysis that was conducted was based on the price movements of these stocks as seen below:
- The percentage increase or decrease of each of these stocks as per different dates is shown below:
As of the As of 13.01.2013
Then the other subsequent performances of the stocks are listed below:
List your portfolio in the following format: As of 20.01.2013
List your portfolio in the following format: As of 27.01.2013
List your portfolio in the following format: As of 10.02.2013
List your portfolio in the following format: As of 24.02.2013
List your portfolio in the following format: As of 03.02.2013
List your portfolio in the following format: As of 10.03.2013
List your portfolio in the following format: As of 16.03.2013
List your portfolio in the following format: As of 23.03.2013
List your portfolio in the following format: As of 30.03.2013
List your portfolio in the following format: As of 06.04.2013
The assessment of the stocks that I dealt in compared to the stocks of other students, shows that my portfolio performed quite well compared to other stocks. This is because of the good standards set by the firms where I purchased stocks. My portfolio included stocks from companies such as Google, Samsung, Tata Motors and Pfizer. These companies have in the past recorded good results and their global operations assist these companies in returning good financial results.
The charts of the two American multinational companies Pfizer and Google are shown below.
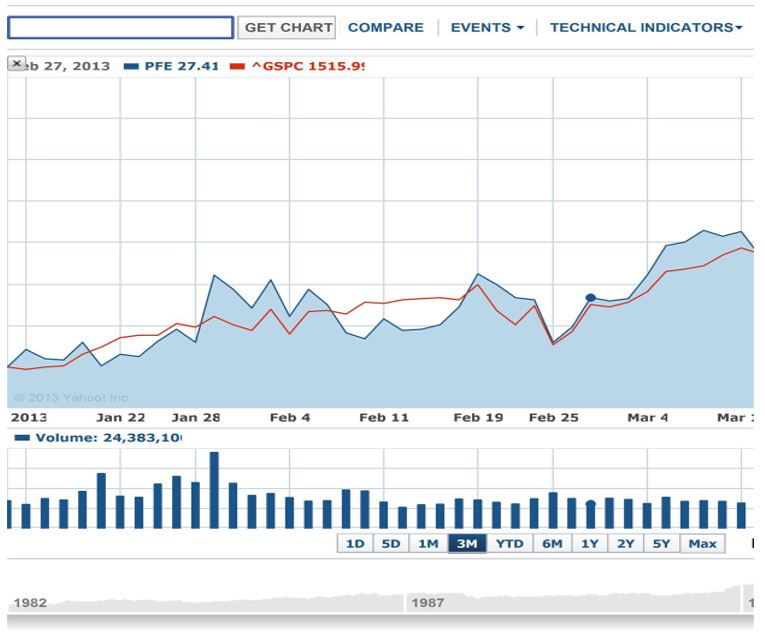
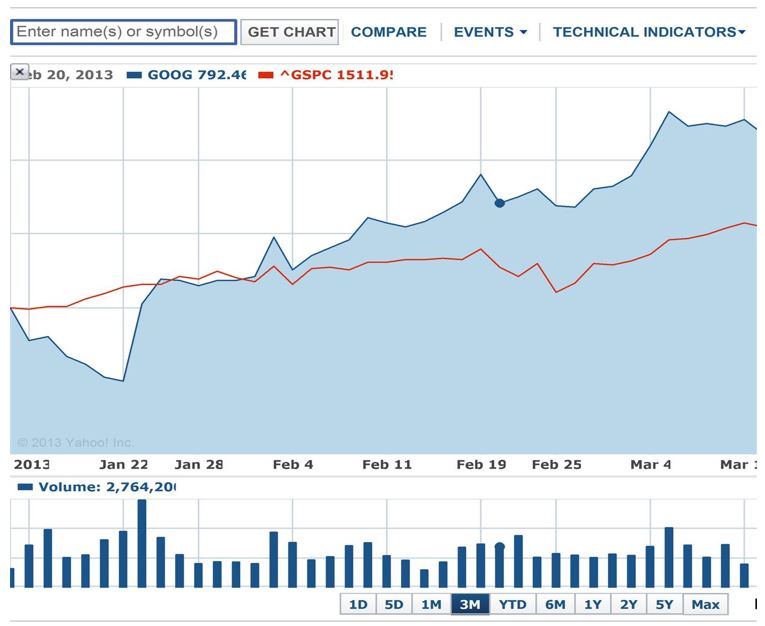
The above charts show the different levels and points in which the Pfizer stocks performed in the last 3 months. Based on the chart, we witness that Pfizer stocks have performed better than the S & P 500 averages in the past 3 months. With the exception of the two weeks between February 4 and 19, 2013, the stock has had a good showing. The same can be attributed to Google which has also had a good performance starting from a low point in January before the stock shoot upwards. The sock has been phenomenal compared to the average performance of all other stocks at the NYSE. The performances of both stocks are not attributed to the performance of other indices at the bourse but due to the individual company performance of both stocks (Fabozzi and Frank 96). Moreover, both companies operate on a global scale and they are affected marginally by the prevailing market conditions within the United States.
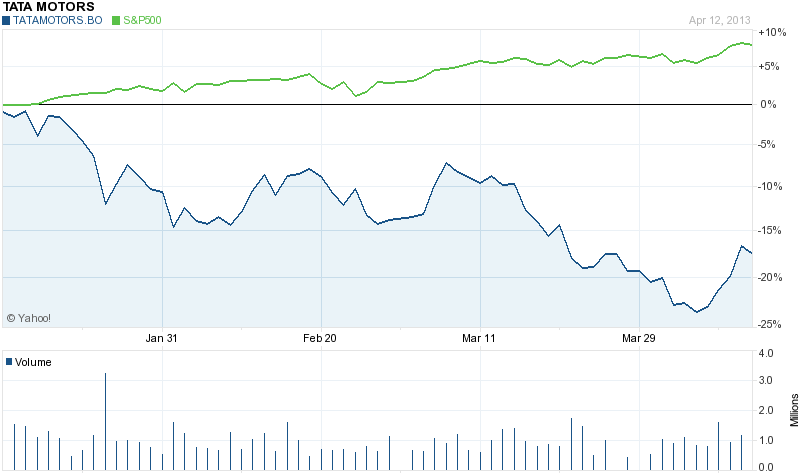
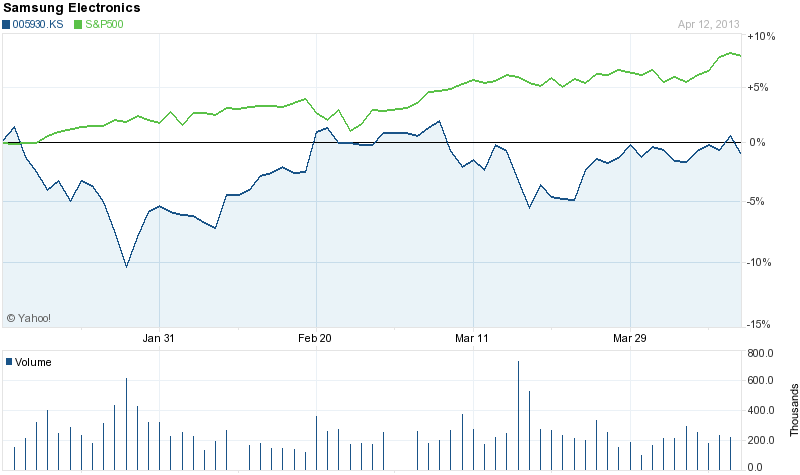
The charts for Tata Motors and Samsung which represent the multinational companies’ performances are shown below:
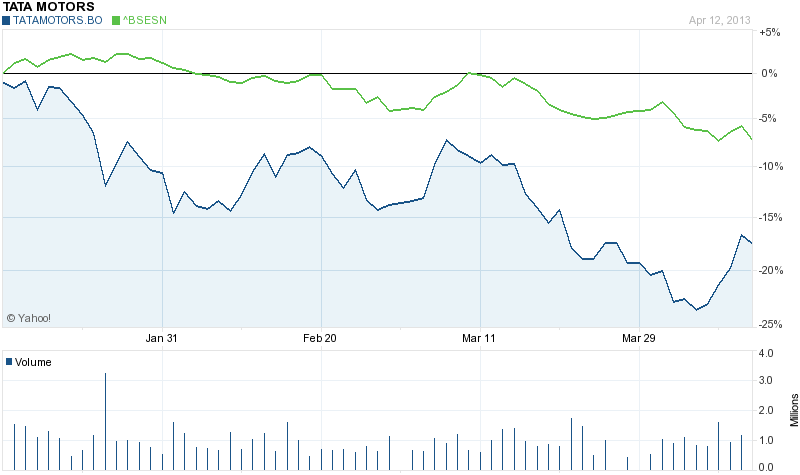
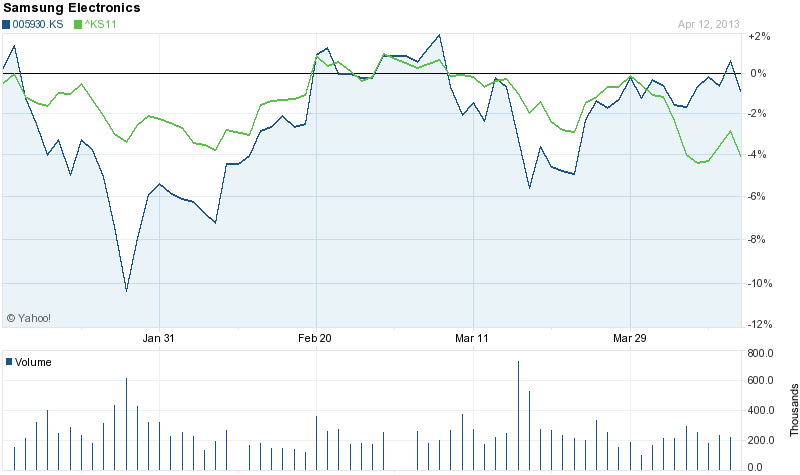
From the above charts, we witness the Samsung Electronics stock is highly correlated with the performance of the Korean (KOSPI) stock exchange. On the other hand, Tata Motors stock is not correlated with the performance of the Bombay stock. This is due to the poor performance of the Tata Motors stock.
The charts below show the performance of Tata Motors and Samsung Electronics in respect to performance of the S&P 500 exchange.
Pfizer and Google corporations conduct most of their businesses using the Unites States dollar. Consequently, they conduct most of their businesses in the United States and Europe. From the analysis of the dollar versus the Euro the stock has been on a rise from a level of 0.75 in January 16, 2013 to a high of 0.7813 on March 29th. The exchange of the dollar versus Euro now stands at 0.7718. This means that these multinational companies will earn less of the foreign exchange and thus it will affect its overall expenditure and profitability of the company (DeFusco 108).
Both the companies deal and conduct business using US Dollars and the same currency exchange rates apply to both companies, Google and Pfizer.
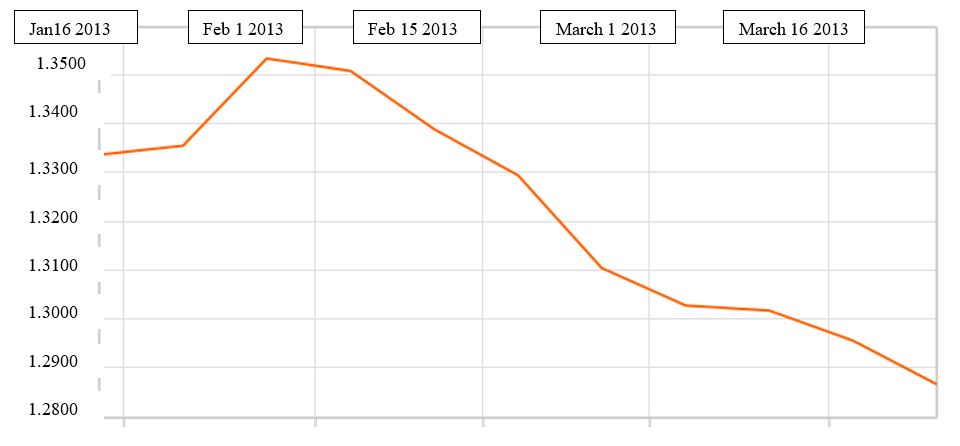
Based on the exchange rate of the Indian Rupee versus the US dollar which is mainly used by Tata Motors, we witness the Indian Rupee has been fluctuating against the Dollar. However, the currency has had few high rises against the dollar. Thus, the currency fluctuations of the Indian Rupee do not affect the stock or sales of Tata Motor Shares.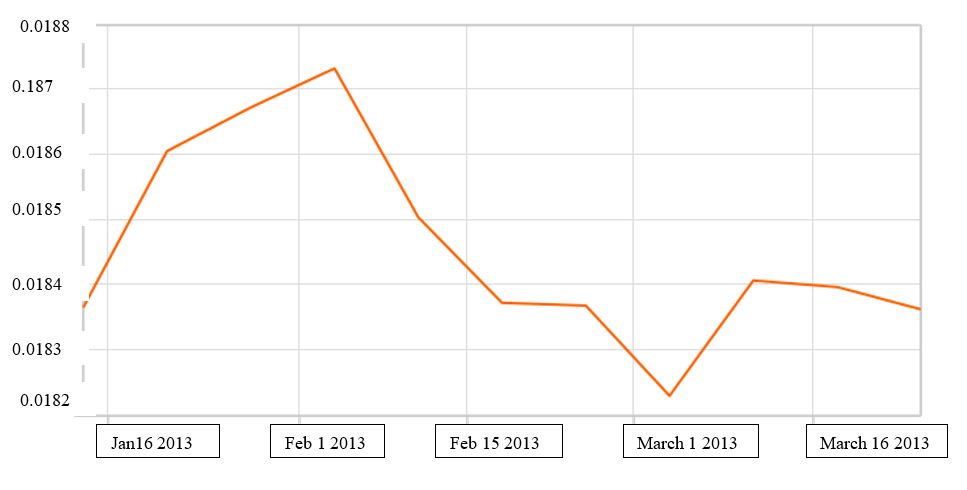
In the case of Samsung Electronics, the company does conduct most of its business and operations using the US dollar. Thus, it fluctuations of its operations are rarely affected in some regions. However, when we analyze the South Korean Won versus the US Dollar, we notice that the currency has been fluctuating often with no clear indication or prediction. As a result, this might adversely affect the profitability and performance of Samsung Electronics’ stock.
References
DeFusco, Richard, McLeavey, Dennis and P Jerald. Quantitative Investment Analysis, San Francisco, CA: Routlegde, 2011. Print.
Fabozzi, Frank and M. Harry. The Theory and Practice of Investment Management: Asset Management, Chicago, IL: John Wiley and Sons, 2010. Print.
Pistolese, Clifford. Select Winning Stocks Using Technical Analysis, Boston, MA: Pelshiver, 2009. Print.