Variables
The exam score is a dependent variable in this study. Exam score has values that range from 1 to 100, which are derived from 50 questions each having 2 points. The exam score is a quantitative variable that is continuous and measurable on an interval scale (Bryman & Cramer, 2005). The exam score is a criterion variable because it depends on the period of study. Comparatively, the study period is an independent variable. A study period is the average number of hours that students studied per week in a given semester. Like exam score, the period of study is a quantitative variable that is continuous and measurable on an interval scale. The study period is a predictor variable because it influences the outcome of the exam score.
Descriptive Statistics
The case summary table below shows that 80 students (N=80) participated in the study. Moreover, it indicates that all of them studied for a given period in the semester and attained certain scores in their exams.
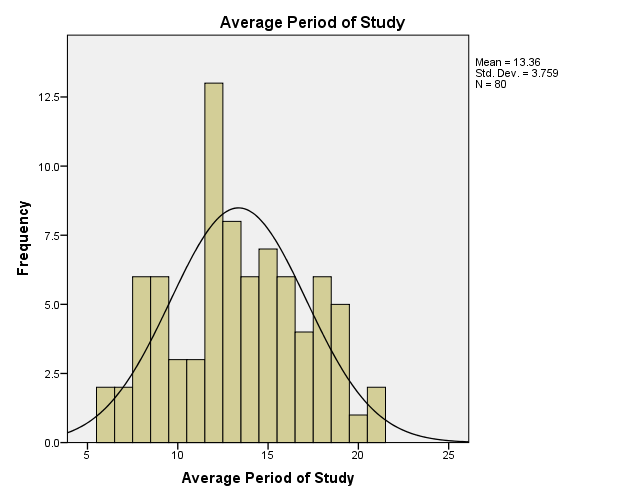
The descriptive table below shows that the average period of study of 80 students is 13.36 hours and the standard deviation is 3.78 (M = 13.36, SD, 3.78). At 95% confidence interval, the lower and upper bound limits are 12.53 and 14.20 hours respectively. The median of the study period is 13.00 while the variance is 14.13. Moreover, the descriptive table shows that the minimum and maximum period of study is 6 and 21 hours respectively with a range of 15 hours.
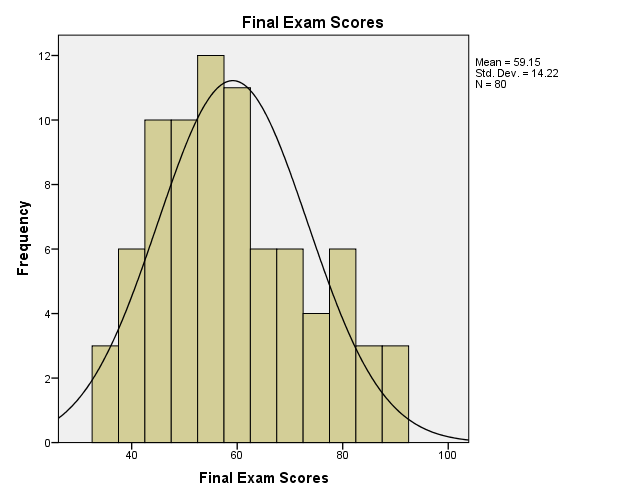
Comparatively, the descriptive table above shows that students have an average exam score of 59.15 and a standard deviation of 14.22 (M = 59.15, SD = 14.22). At 95% interval, the lower and upper bound limits are 55.99 and 62.31 scores respectively. While the median of the exam scores is 56.50, the variance is 202.2. The descriptive table also shows that the range of exam scores is 55, with the minimum score being 35 and the maximum score being 90.
Regarding distribution, the average period of study has a kurtosis of 0.76 and skewness of 0.02. The distribution bar graph below depicts that the average period of study is close to normal distribution.

Analysis of the distribution of final exam scores shows that they have a kurtosis of 0.67 and a skewness of 0.43. According to Jackson (2012), kurtosis and skewness of a normal distribution curve are zero. Thus, the distribution table below shows that the exam scores follow a normal distribution.

Correlation
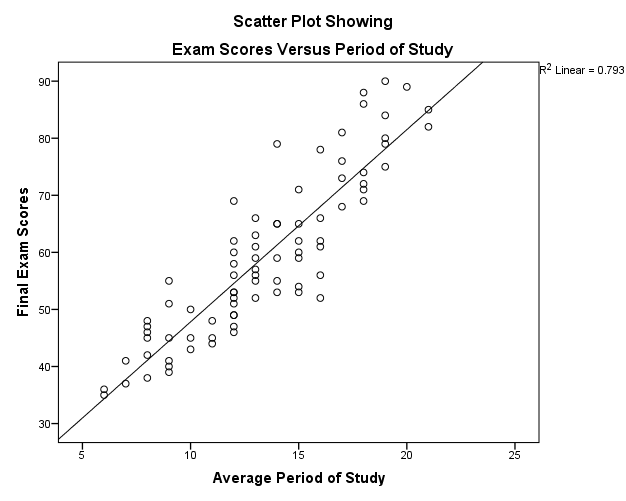
The scatter plot depicts the existence of a positive correlation between exam scores and the period of study. The coefficient of determination is 0.793 (R2 = 0.793). The R-square is the square of the regression coefficient (Weinberg & Abramowitz, 2008). In this view, coefficient of determination depicts that correlation is the best model that predicts the relationship between the two variables by 79.3%.

The correlation analysis of the average period of study and exam scores shows that there is a significant relationship. According to Pearson’s correlation, the average period of study and exam scores has a correlation coefficient of 0.89, which depicts the existence of a strong positive correlation. Likewise, Spearman’s correlation coefficient is 0.893, which shows a very strong positive correlation. The significant value at α level of 0.01 (two-tailed) in both Pearson and Spearman’s correlation indicates that there is a significant relationship between exam scores and period of study (0.000<0.01).
Pearson’s Correlation
Spearman’s Correlation
From the correlation analysis, one can derive the conclusion that the average period of study significantly influences exam scores among students who take the accounting course. Since the study collected data from an accounting class, the findings may not apply in other courses. Thus, extrapolation of the findings requires consideration of the courses that students undertake.
Regression
In the regression analysis, the average period of study is a predictor of the exam scores. From the model summary table below, R-square is 0.793, which means that the average period of study predicts 79.3% of the exam scores.
The regression table below provides coefficients of the regression equation (y = a + b*x). From the table, a = 14.141, while b = 3.368. Both a and b coefficients are significant because they are less than 0.01 (0.000<0.01). Hence, the regression equation of this study is that:
Exam score = 14.141 + 3.368*period of study.
Conclusion
In this study, the predictor variable is the period of study, while the criterion variable is the exam score. The regression equation of this study is that exam score = 14.141 + 3.368*period of study. Basing on this equation, one can calculate the exam score given the period of study. For example, if the period of study is 18 hours, then exam score = 14.141 + 3.368*18 = 74.765. In the regression table, the regression error is 2.704, which means that one can predict criterion variable with an error margin of 2.704 using the regression equation. From the correlation and regression analysis, one can conclude that period of study significantly correlate with exam score among accounting students. Owing to variability in courses, this conclusion is not applicable in all courses. Given that the study involved accounting students only, the data has low external validity, and thus interpretation should only apply to accounting courses or classes.
References
Bryman, A., & Cramer, D. (2005). Quantitative data analysis with SPSS12 and13: A Guide for Social Scientists. New York: Routledge.
Jackson, S. L. (2012). Research methods and statistics: A Critical Thinking Approach (4th ed.). Belmont, CA: Wadsworth.
Weinberg, S., & Abramowitz, S. (2008). Statistics Using SPSS: An Integrative Approach. Cambridge: Cambridge University Press.