Executive Summary
The Australian Health Industry contributes heavily to the Australian national GDP. It provides employment to nearly 1.8 million natives of Australia.
However, with challenges related to remoteness and recent cases of COVID-19, most people have been faced with issues in accessing medical services.
These challenges can be resolved through the inception of data processing techniques, such as quantitative methods, including tools like line charts and graphs. This can be done with respect to three major reasons.
This entails visualization of facts, visualization of figures and implication of data being used.
Similarly, the medical industry is being provided with crucial recommendations on the basis of data research and techniques. This entails the inclusion of ambulatory care services that will help to boost the reach of medical services to patients.
Data analysis is also associated with key data ethics that focus on providing informed consent and protection of patient privacy in the medical sector.
Industry Problem
Healthcare in Australia is well-established and makes a significant contribution to the country’s economy. According to the Australian Bureau of Statistics, it employs around 1.8 million people, and that number is expected to rise to 2 million by 2025. (AISC, 2021). The sector spent $185 billion on health products and services in 2017 and 2018. This spending has increased to 10% with respect to GDP between 2017 to 2018 (Australian Institute of Health and Welfare, 2020). There are still a few issues for individuals who are significant stakeholders, such as rising medical expenditures and delayed treatments (Macri, 2016). Costs have risen as a result of technological innovation, causing a delay in service delivery for some customers. COVID-19 is a crucial factor in the delay of service delivery to patients. Among those who were affected, 17.3% needed to see a mental health professional, but only 34.3% were able to do so (ABSC, 2021). According to an online dental referral service, 12.2% of consumers delay seeing a dentist when they really need one because of COVID-19’s inception.
The difference between life and death might be determined by the length of time it takes to get help. If individuals are given a genuine answer to this problem, then lives can be saved. The data on the problem can provide a better understanding of it, and the primary parties affected by it may be categorized (Gaurav, 2017). When designing the mitigation strategy for the targeted results, this might be helpful. There may be remedies or recommendations for overcoming the issues described and predicted by the description and predictive analysis.
Different services and related challenges can be grouped based on the availability of the data. It is possible to identify the most impacted market segment and to propose solutions that are geared toward that particular market group. If one has a lot of data, data science can help them make sense of it. It may be able to transform the raw data into a form that may be used to identify the most immediate concerns (Gaurav, 2017). The healthcare sector can investigate the root causes of the problem, such as high costs and lengthy wait times to see a general practitioner, an after-hours GP, a dentist, or other medical experts. Better solutions, services, and products may be delivered to the public at acceptable rates by managing cost considerations derived from data analytics (Gaurav, 2017). COVID-19’s delays may be eliminated if new solutions are applied to the problem. Data has always been important in addressing company and industrial challenges.
Data Processing and Management
The Australian Bureau of Statistics (ABS) is the primary source of information on this identified problem. This is the Australian official national statistical agency. An extensive array and variety of data viewpoints are available in the areas of society, politics, economics, environment, industry and business issues (ABS, 2022). Since they are official government sources, the data in these sources may be relied upon to be accurate. Descriptive data analysis is also available on the website for any faults, issues, or elements found in the data.
A thorough examination of the issue’s history is critical to understanding its root causes. With an understanding of the root causes, it will be easier to evaluate the way data is managed and processed (ABS, 2022). As a result, a descriptive approach would be able to access the previous data and effectively explain it. It would condense the information into a more digestible form while also improving the visual appearance of the raw data (UNSW Sydney, 2020). This problem or issue’s future tendencies can be predicted using predictive analysis based on previous and present patterns (Kumar, 2018).
The data cleansing technique which was applied is as follows:
- Removing the Duplication: Duplicate data can be easily merged into a set of one raw data since its high cost has been assigned a duplicity on the ABS site thus reducing the impacts of patients failing to access health services on time.
- Remove Irrelevant: There was a lot of data which was considered as irrelevant such as data pointing to gender, age and sex and therefore was successfully ignored.
- Conversion of Data: Data that had been tabulated on the site was converted into tables and then into bar graphs for easier analysis.
- Descriptive and Predictive Technique: In order to analyze the current trends in the industry, descriptive techniques of data analysis were adopted. Additionally, predictive techniques were adopted in a bid to further predict the future trends in the data (Roldos, 2021).
Data Analytics Methodology
Quantitative analysis is a technique employed for data analysis in this analytical process. This approach gives the data in the form of numbers, each having a unique and distinct value linked with the data collection. Data gathering and analysis may be quantified using this approach, thus providing reliable results (OECD, 2019). Trend analysis, pie charts, and bar graphs are some of the supporting tools in quantitative data methodology.
The rationale for selecting this methodology technique is that it allows for easy interpretation of the graphs and a descriptive perspective of the data. Audience users will be able to grasp it in a jiffy (Boateng, 2020). In addition, data may be presented in a predicted manner using trend analysis and bar graphs. Numeric data should be used to represent the raw data about people’s experiences with the healthcare industry (Gaurav, 2017). There was no way for the quantitative data analysis to offer a visually appealing insight into the trends, but the graphical display can do so in a single glance of the presentations.
- Nature of Variables: Data contained in the quantitative data methodology is composed of various variables such as age, sex, and gender that are measurable and presentable.
- Instruments: This methodology technique is composed of instruments such as trend charts, pie charts, and bar graphs which as standardized.
- Form of Presentation: Data from the analysis can be presented in form of chart forms, tables of graphs after being quantified and formed in a descriptive type. Later on, the various figures used can be created using the quantified data.
- Predictability: The prediction of the future trend of the data can be easier by analyzing the created trend graphs and bar graphs after a graphical presentation of the collected data.
- Sample Size: This data methodology technique allows for the researcher to have a larger sample size for the data analysis process.
- Reliability: The tools and data methodology technique used to provide reliable and real data results. The data outcomes are founded on totally raw data, therefore, provided that the raw data used are accurate, then the resulting outcomes for the quantitative data analysis will be real and reliable to be used for the process.
- Future Research: Quantitative data and its subsequent techniques and tools are presented in a clear form that allows for future analysis if there is need (Gaurav, 2017).
Visualization and Evaluation of Results
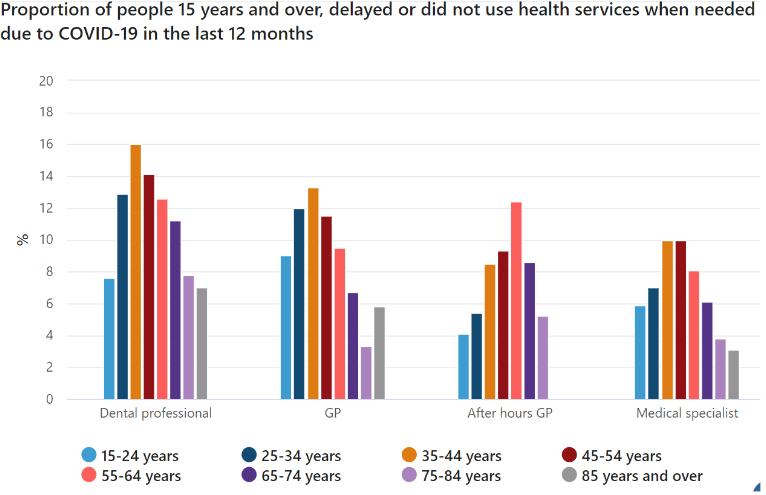
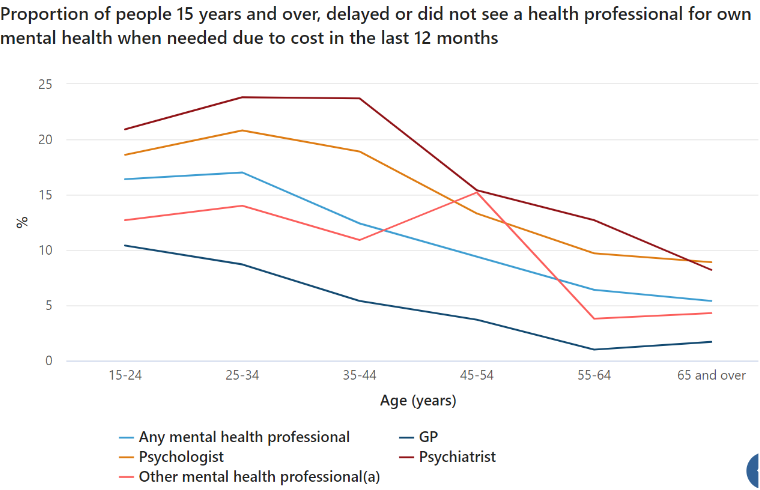
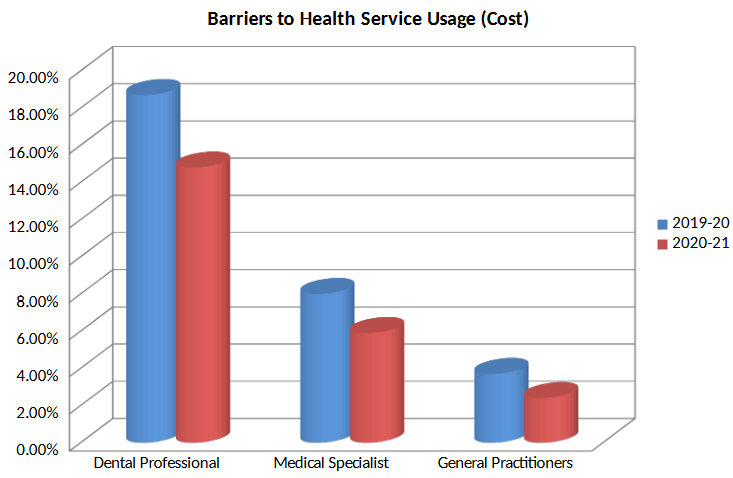
After the cleansing process, the visual presentation of data is as follows. The visual presentation of data is a full descriptive analysis. With a clear view of the trends, the future predictions for the year 2020-2021 can be easily formulated as well.
Comparative Decrease in Health Service Usage
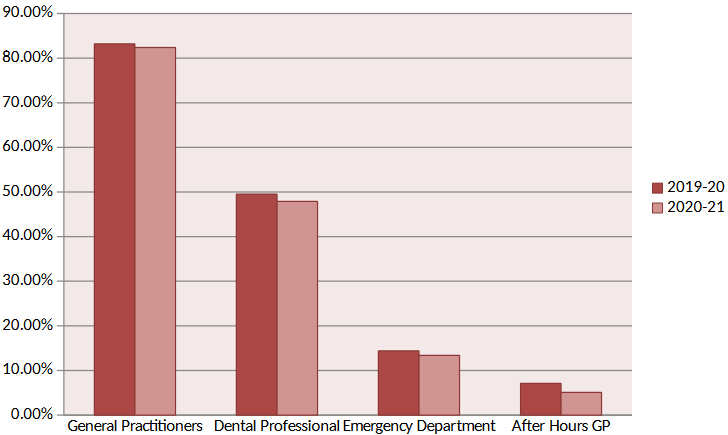
Comparative Health Service Usage by Region
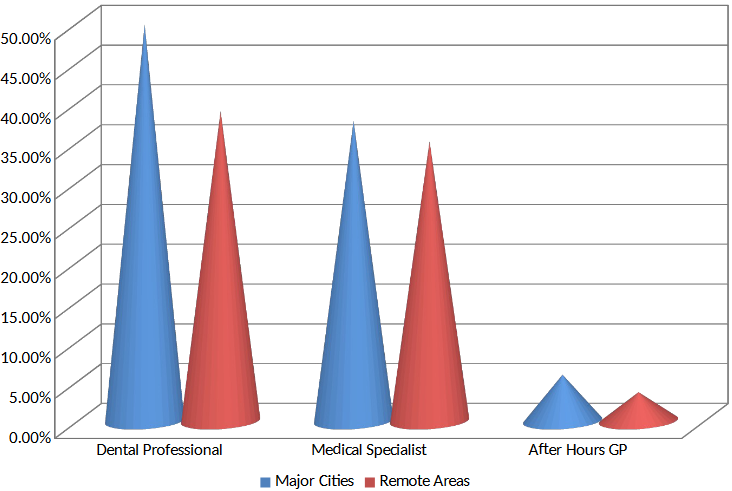
The visuals depict a comparative analysis of two different eras, as well as various places and age groups. The sector is dealing with severe difficulty as a result of a decrease in the use of health services among patients due to issues such as remoteness and the emergence of COVID-19 (Lepenioti et al., 2020). The numerous elements that have influenced people’s interest in these services are depicted in these graphics. It is critical to use these kinds of visuals to convey all aspects of the impact category. Health sector trends may be used to predict future trends by examining the current and historical data. This is illustrated in Figure 2 by a decline in service utilization as a function of increasing medical costs over time. As a result of rising costs, older people are less likely to use the service due to lack of money to fund the process. In addition, the bar graph shows how consumption of the services fell from 2019-20 to 2020-21 owing to price issues. The decline has been described for each of the several services being provided. The comparative study may be readily seen in the conical bar graphs, which demonstrate that in major cities, individuals are more likely to receive the services compared to those in less developed areas.
Consequently, the descriptive analysis approach has been used to explain the data’s main characteristics and attributes. In addition, quantitative methods of analysis are employed herein. The entire data set has been provided in the form of numerical values, which indicate the trends and other information that can be used to predict future trends (Lepenioti et al., 2020). The Health Industry may have a better grasp on the recent past and current period with the help of clear research and assessment using descriptive and predictive approaches and quantitative methods. Policy and mitigation plans can then be developed and implemented based on this trends that have been provided.
Recommendations
There is a route and a road map for the future of health care that highlights the industry’s dimensions and elements that have influenced health services. The problem in the sector is that individuals are unable to get the services they need until it is too late. The reasons for this have been cited as high expenses, the inception of COVID-19, and a lack of proper infrastructure that renders some people remote.
The health industry must ensure that methodologies and services are cost-effective if everyone in the world is to have access to them without any challenges. Higher and more advanced technology utilization has led to an increase in the cost of products and services in the health sector in Australia. In addition, COVID-19 has made it more difficult for people in need of medical care to access the services they need. This means that the Australian healthcare system should invest more money in ambulatory care services like physical therapy and occupational therapy. This might help those who are unable to get to the hospital in time because of COVID-19 restrictions by the government. Ambulatory care makes it possible to reach patients in remote locations (Boateng, 2020). Another option for the health industry is to develop clinics in remote areas that are well-equipped with well-trained personnel to offer health services. Everyone who has a role to play in addressing the issue and its various facets, such as medical and health specialists, health departments, government and other organizations, must do their part to ensure that it is properly addressed (Fernando, 2017). Finding the right solution to this issue may depend on these aspects.
When interpreting this data only a small number of factors impacting health care services may be considered. Overall, high costs, COVID-19, and remoteness variables have been addressed in this article so far. The examination of the cost component and its sub-factors should have been improved. While this may be the case, a greater understanding of the issue and its underlying components has emerged. There is now a consensus in the industry about what they need to focus on first, which is reducing costs and increasing the accessibility of individuals to services (Fernando, 2017). The above-discussed recommendations can be applied is a better way to realize the immediate solutions to the challenges that continue to face the health industry.
Despite the fact that these are only some of the challenges that have come to light so far, there may be more to come in the coming years. The qualitative approach can be used in conjunction with the quantitative method to realize effective outcomes (Fernando, 2017). The qualitative technique comprises an in-depth behavioral analysis of the theoretical components of the data, such as what, when, who, and how aspects. It focuses on the root causes of what is happening and why and examines the underlying behavioral links of the data set. When it comes to industry trends, descriptive data analysis is now providing a view of the current and historical trends in the health industry. However, predictive analysis may also be used to forecast the effects of certain elements in the future (Fernando, 2017). These findings might be used to provide more accurate results for future analysis. In addition, trend analysis is the most important instrument to employ. It is possible to determine the flow of the parameter using this trend analysis tool, and controls may then be applied accordingly.
When it comes to prescriptive analytics, the goal is not merely to anticipate what will happen but also to make recommendations on how companies may best avoid or reduce unfavorable outcomes. Few healthcare organizations have the capacity to take use of this final application of data on a big scale or in a meaningful way because of the complex and integrated data analytics infrastructure required (El Morr and Ali-Hassan, 2019). There is no doubt that prescriptive analytics is the next step in the evolution of healthcare big data. While machine learning advances and algorithms become almost unnervingly sophisticated, the healthcare industry has a tremendous opportunity to take advantage of these decision-making abilities. The Internet of Things is creating a new way of viewing patient data as machine learning advances with its algorithms becoming more sophisticated.
As a result of quantitative research, a larger picture is shown to the audience or viewers. The data is the only foundation for the entire picture. Therefore, it is possible that viewers may begin to focus on more general aspects of the problem or issue at hand. Similarly, it is possible that if the industry relies solely on the quantitative approach, it will put more emphasis on cost-cutting than on improving the quality of medical services (El Morr and Ali-Hassan, 2019). Because of this, qualitative research takes on great relevance and value at that moment in time. As a long-term concern, the elements that are characterized as a barrier to industry, such as cost alone, may allow the industry to grow technologically in the future. As technology advances, it may ultimately be possible for the industry to prosper economically.
Developers’ visions of the technologies of the future leave virtually no limits on the potential reach and depth of predictive analytics. Currently, many healthcare providers are still trying to break out of EHR data locked rooms (Fernando, 2017). Therefore, an industry-wide push toward embracing healthcare big data analytics is accelerating the development of an infrastructure that can support prescriptive analytics and meaningful advances in quality, timeliness, and efficacy of service delivery to patients.
Data Ethics and Security
The code of behavior for data ethics and security in the health industry in Australia applies to data analysis processes. Statistics obtained from the Australian Bureau of Statistics give an overview sight of the challenges and their corresponding numbers and statistics (ABS, 2022). For instance, when it comes to health care costs, for example, there is no clear information on the region or the class or group of individuals affected by the problem (Luciano, 2016). It would be a violation of data ethics and security to share the results of such a thorough investigation because it would reveal the respondents’ and region’s personal information.
There are possibilities that other institutions may misuse the data, presenting it as their own and therefore breaking the rules of behavior on the ownership of information (Luciano, 2016). As listed below, data analysis must meet the following ethical standards:
- Institutional Review: An organization, such as the ABS, which provides current health industry statistics, should advocate for the data as it is offered in the data used in this research.
- Anonymity of the subject: The subject’s privacy is protected as part of the data ethics. It is not necessary to identify the people who provided the information or their geographic location. A violation of one’s privacy must be avoided.
- Passing data to third parties: For healthcare providers, it is important to have an agreement in place that governs how data will be used and how it will be protected before sharing it with other parties.
- Receiving data from third parties: One must validate that the usage of data in their research is compliant with what the data subjects were informed would happen to the data if you are utilizing data from another organization or obtained from the Internet. In Twitter’s case, users are informed that their public tweets would be utilized for study; in Facebook’s case, users are informed that their postings will not be collected automatically (Luciano, 2016).
Hence, the code of conduct, no invasion of privacy, ethnicity of the operations under research and post-research impacts should be regulated in accordance with such data ethics (Luciano, 2016). The regulatory authority for research and data analysis should also pay attention to the aforementioned regulations and make certain that data ethics are being followed.
Self-Reflection
The dataset presented has thoroughly analyzed the facts and provides strong support for the course learning outcomes. Data may be presented in a way that is understandable to non-specialists and non-experts alike by using a combination of descriptive and quantitative techniques. Management will be able to make more informed decisions about the company issue after having a clearer picture of the situation. The project’s ethical considerations for data privacy are also addressed. It is, however, the application of a curious mindset that should be given greater attention. The DATA6000 project has the potential to be more exploratory and open to new approaches to solving business challenges. As a whole, the course’s learning outcomes have been fully met.
Reference List
ABS. (2021) Patient experiences in Australia: summary of findings.[Online] Web.
ABS. (2022) Welcome to the Australian Bureau of Statistics. [Online] Web.
AISC. (2021) Health. [Online] Web.
Australian Institute of Health and Welfare. (2020) Health expenditure. [Online] Web.
Boateng, C.O. (2020) Three ways data science can help solve problems in your business. [Online] Web.
El Morr, C. and Ali-Hassan, H. (2019) ‘Descriptive, predictive, and prescriptive analytics’. In Analytics in Healthcare (pp. 31-55). Springer, Cham.
Fernando, D.F.A.Q. (2017) ‘Strengths and limitations of qualitative and quantitative research methods’. European Journal of Education Studies, 3(9), pp.369-87.
Gaurav Verma, K.S. (2017) ‘The role of quantitative techniques in business and management. Journal of Humanities Insights, 1(1), pp.24-26.
Kumar, M.L. (2018) ‘Predictive analytics: a review of trends and techniques.’ International Journal of Computer Applications, 182(1), pp. 31-37.
Lepenioti, K., Bousdekis, A., Apostolou, D. and Mentzas, G. (2020) ‘Prescriptive analytics: literature review and research challenges.’ International Journal of Information Management, 50, pp. 57-70.
Luciano, M.T. (2016) ‘What is data ethics?’ Philosophical Transactions of The Royal Society A Mathematical Physical and Engineering Sciences, 374(2083).
Macri. (2016) ‘Australia’s health system: some issues and challenges.’ Journal of Health & Medical Economics, 2(2).
OECD. (2019) Quantitative data. [Online] Web.
Roldos, I. (2021) 8 effective data cleaning techniques for better data. [Online] Web.
UNSW Sydney. (2020) Descriptive, predictive & prescriptive analytics: what are the differences? [Online] Web.